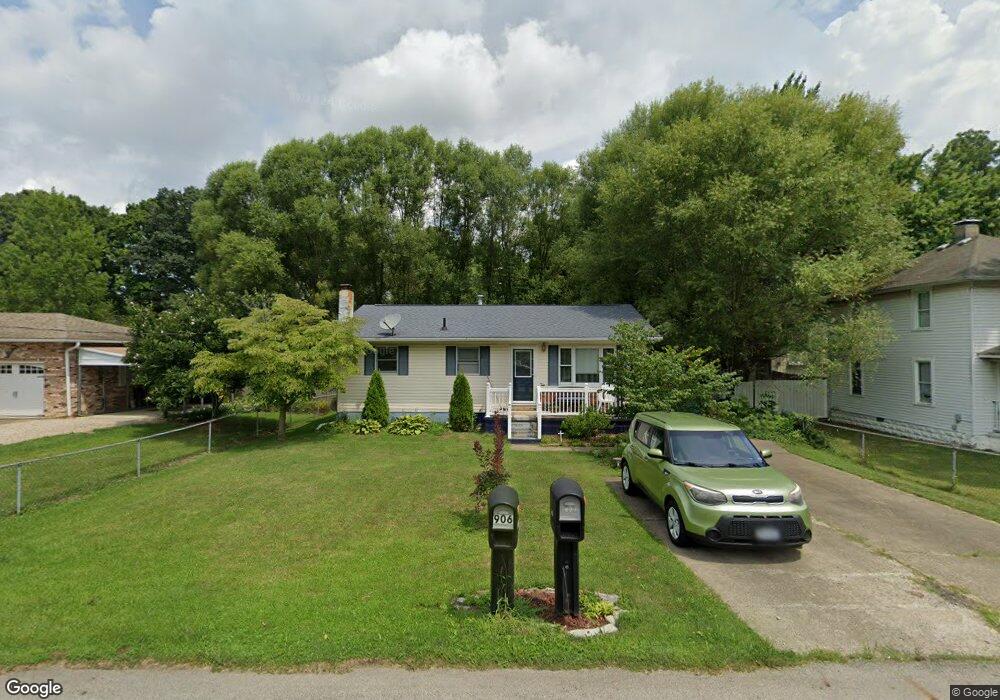
971 Spring St Lancaster, OH 43130
Estimated Value: $193,740 - $258,000
3
Beds
1
Bath
1,080
Sq Ft
$200/Sq Ft
Est. Value
About This Home
This home is located at 971 Spring St, Lancaster, OH 43130 and is currently estimated at $215,685, approximately $199 per square foot. 971 Spring St is a home located in Fairfield County with nearby schools including Tallmadge Elementary School, General Sherman Junior High School, and Lancaster High School.
Ownership History
Date
Name
Owned For
Owner Type
Purchase Details
Closed on
Apr 5, 2019
Sold by
Morgan Christopher A and Morgan Family Trust
Bought by
Finley Kathy Jo and Morgan Family Trust
Current Estimated Value
Purchase Details
Closed on
Sep 18, 2017
Sold by
Konkler Douglas E and Morgan Linda S
Bought by
Morgan Christopher A and The Morgan Family Trust
Purchase Details
Closed on
Jul 25, 2017
Sold by
Estate Of Edward H Konkler
Bought by
Knokler Douglas E and Morgan Linda S
Purchase Details
Closed on
Oct 21, 2008
Sold by
Morgan Roger L and Citifinancial Mortgage Company
Bought by
Konkler Edward H
Home Financials for this Owner
Home Financials are based on the most recent Mortgage that was taken out on this home.
Original Mortgage
$30,000
Interest Rate
6.09%
Mortgage Type
Commercial
Purchase Details
Closed on
Feb 1, 2006
Sold by
Morgan Roger L
Bought by
Morgan Linda S
Create a Home Valuation Report for This Property
The Home Valuation Report is an in-depth analysis detailing your home's value as well as a comparison with similar homes in the area
Home Values in the Area
Average Home Value in this Area
Purchase History
| Date | Buyer | Sale Price | Title Company |
|---|---|---|---|
| Finley Kathy Jo | -- | None Available | |
| Morgan Christopher A | -- | None Available | |
| Knokler Douglas E | -- | None Available | |
| Konkler Edward H | $62,000 | Attorney | |
| Morgan Linda S | -- | None Available |
Source: Public Records
Mortgage History
| Date | Status | Borrower | Loan Amount |
|---|---|---|---|
| Previous Owner | Konkler Edward H | $30,000 |
Source: Public Records
Tax History
| Year | Tax Paid | Tax Assessment Tax Assessment Total Assessment is a certain percentage of the fair market value that is determined by local assessors to be the total taxable value of land and additions on the property. | Land | Improvement |
|---|---|---|---|---|
| 2025 | $3,909 | $68,620 | $14,440 | $54,180 |
| 2024 | $3,909 | $43,480 | $7,980 | $35,500 |
| 2023 | $1,248 | $43,480 | $7,980 | $35,500 |
| 2022 | $1,268 | $43,480 | $7,980 | $35,500 |
| 2021 | $1,275 | $31,970 | $7,980 | $23,990 |
| 2020 | $1,282 | $31,970 | $7,980 | $23,990 |
| 2019 | $1,135 | $31,970 | $7,980 | $23,990 |
| 2018 | $947 | $23,980 | $5,590 | $18,390 |
| 2017 | $972 | $25,340 | $5,590 | $19,750 |
| 2016 | $948 | $25,340 | $5,590 | $19,750 |
| 2015 | $942 | $24,450 | $5,590 | $18,860 |
| 2014 | $899 | $24,450 | $5,590 | $18,860 |
| 2013 | $899 | $24,450 | $5,590 | $18,860 |
Source: Public Records
Map
Nearby Homes
- 0 Highland Ave
- 772 Pennsylvania Ave
- 729 Pennsylvania Ave
- 219 Peters Ave
- 114-116 S Cedar Ave
- 157 Cedar Hill Rd
- 453 Bren Dr
- 1414 Cedar Hill Rd
- 1511 Cedar Hill Rd
- 132 N Pierce Ave
- 233 Lewis Ave
- 126 Twin Creek Way
- 113 N George St
- 520 W Wheeling St
- 0 Hamburg Rd SW
- 0 Hamburg Rd SW Unit 226000938
- 302 Washington Ave
- 757 W Mulberry St
- 0 N Columbus St
- 215 Summitview Dr
Your Personal Tour Guide
Ask me questions while you tour the home.