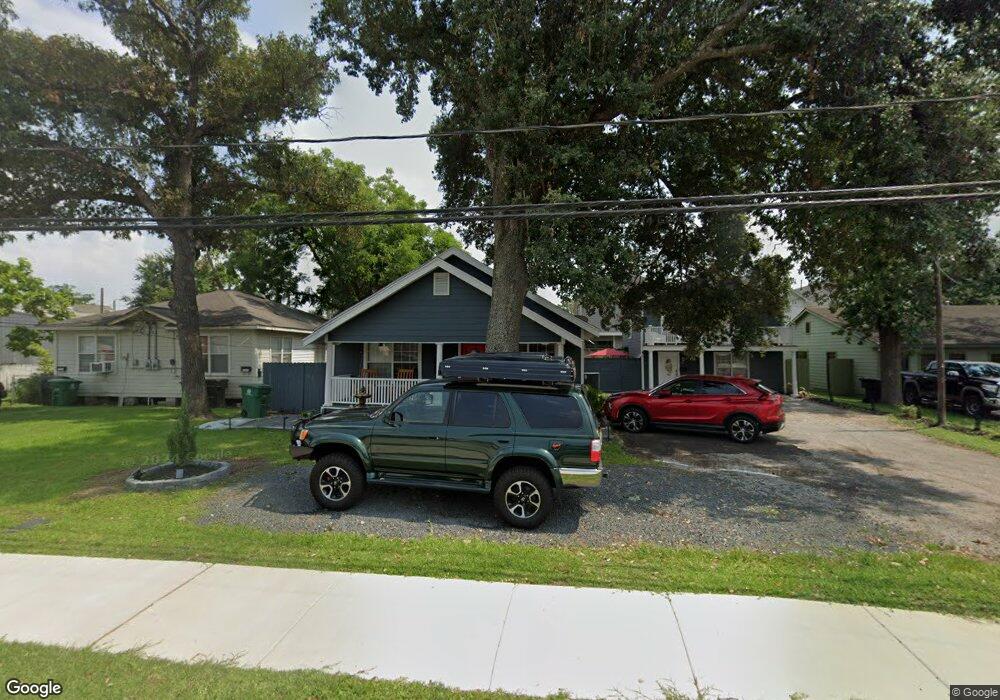
971 Wakefield Dr Unit 971 1/2 Houston, TX 77018
Oak Forest-Garden Oaks NeighborhoodEstimated Value: $448,000 - $830,000
3
Beds
2
Baths
1,350
Sq Ft
$446/Sq Ft
Est. Value
About This Home
This home is located at 971 Wakefield Dr Unit 971 1/2, Houston, TX 77018 and is currently estimated at $602,056, approximately $445 per square foot. 971 Wakefield Dr Unit 971 1/2 is a home located in Harris County with nearby schools including Garden Oaks Montessori, Frank Black Middle School, and Waltrip High School.
Ownership History
Date
Name
Owned For
Owner Type
Purchase Details
Closed on
Oct 2, 2025
Sold by
Gonzalez Alvarez Aritzabel and Aritzabel Okane Aritzabel
Bought by
Gonzalez Alvarez Aritzabel
Current Estimated Value
Home Financials for this Owner
Home Financials are based on the most recent Mortgage that was taken out on this home.
Original Mortgage
$451,750
Outstanding Balance
$451,750
Interest Rate
6.58%
Mortgage Type
Credit Line Revolving
Estimated Equity
$150,306
Purchase Details
Closed on
Mar 29, 2004
Sold by
Shepherd Walter
Bought by
Okane Aritzabel
Home Financials for this Owner
Home Financials are based on the most recent Mortgage that was taken out on this home.
Original Mortgage
$128,000
Interest Rate
5.75%
Mortgage Type
Purchase Money Mortgage
Create a Home Valuation Report for This Property
The Home Valuation Report is an in-depth analysis detailing your home's value as well as a comparison with similar homes in the area
Home Values in the Area
Average Home Value in this Area
Purchase History
| Date | Buyer | Sale Price | Title Company |
|---|---|---|---|
| Gonzalez Alvarez Aritzabel | -- | None Listed On Document | |
| Okane Aritzabel | -- | Texas Nations Title Agency |
Source: Public Records
Mortgage History
| Date | Status | Borrower | Loan Amount |
|---|---|---|---|
| Open | Gonzalez Alvarez Aritzabel | $451,750 | |
| Previous Owner | Okane Aritzabel | $128,000 | |
| Closed | Okane Aritzabel | $32,000 |
Source: Public Records
Tax History Compared to Growth
Tax History
| Year | Tax Paid | Tax Assessment Tax Assessment Total Assessment is a certain percentage of the fair market value that is determined by local assessors to be the total taxable value of land and additions on the property. | Land | Improvement |
|---|---|---|---|---|
| 2025 | $8,786 | $560,215 | $398,760 | $161,455 |
| 2024 | $8,786 | $611,308 | $398,760 | $212,548 |
| 2023 | $8,786 | $526,090 | $345,592 | $180,498 |
| 2022 | $10,477 | $526,090 | $345,592 | $180,498 |
| 2021 | $10,082 | $520,000 | $345,592 | $174,408 |
| 2020 | $9,523 | $543,837 | $305,716 | $238,121 |
| 2019 | $9,046 | $365,280 | $265,840 | $99,440 |
| 2018 | $6,310 | $325,000 | $199,380 | $125,620 |
| 2017 | $8,218 | $325,000 | $199,380 | $125,620 |
| 2016 | $8,765 | $488,865 | $264,480 | $224,385 |
| 2015 | $5,743 | $444,785 | $220,400 | $224,385 |
| 2014 | $5,743 | $344,476 | $176,320 | $168,156 |
Source: Public Records
Map
Nearby Homes
- 1003 Wakefield Dr
- 3607 Cedar Vista Ln
- 3511 Autumndale Dr
- 3502 Autumndale Dr
- 954 Fisher St Unit E
- 1021 Wakefield Dr
- 1025 Wakefield Dr
- 925 Fisher St Unit D
- 923 Fisher St Unit A
- 3505 Golf Dr Unit D
- 963 W 41st St
- 1414 W 34th 1/2 St
- 1424 W 34th 1/2 St
- 915 W 35th St Unit B
- The Austin Plan at Park View
- The Bennett Plan at Park View
- 909 Fisher St
- 1112 Kinley Ln
- 1115 Du Barry Ln
- 959 Althea Dr
- 971 Wakefield Dr
- 971 Wakefield Dr
- 971 Wakefield Dr Unit 971 1/2
- 969 Wakefield Dr Unit 1
- 962 Judiway St
- 964 Judiway St
- 960 Judiway St
- 966 Judiway St
- 963 Wakefield Dr
- 975 Wakefield Dr
- 958 Judiway St
- 968 Judiway St
- 980 Wakefield Dr
- 970 Wakefield Dr
- 955 Wakefield Dr
- 962 Wakefield Dr
- 954 Judiway St
- 954 Judiway St Unit D
- 954 Judiway St Unit C
- 954 Judiway St Unit B