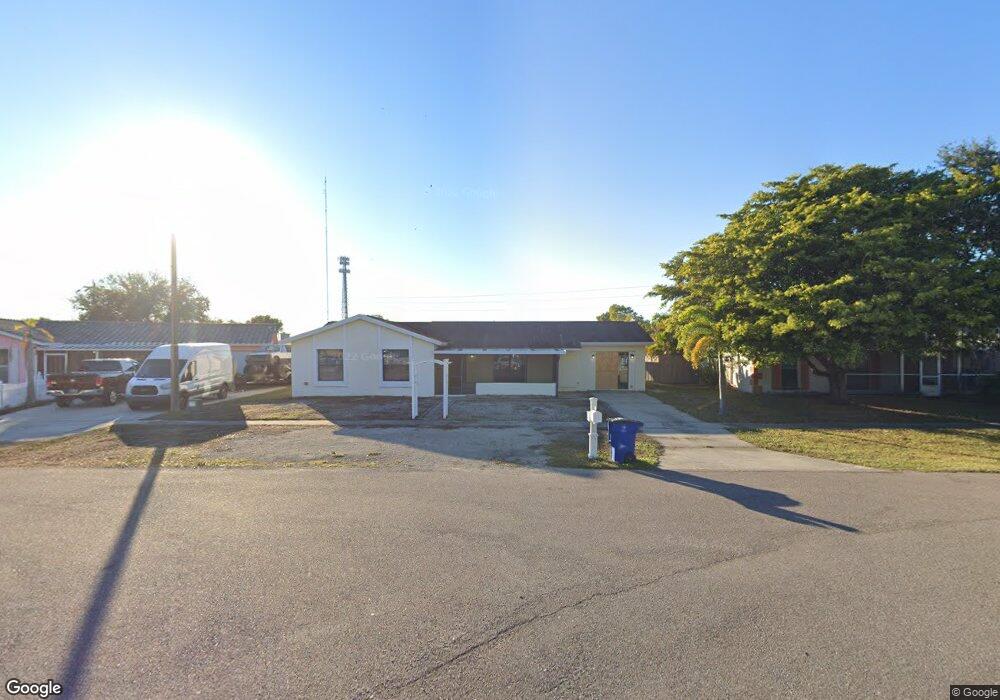
971 Winsome Rd North Fort Myers, FL 33903
Hancock NeighborhoodEstimated Value: $268,000 - $297,000
3
Beds
2
Baths
2,001
Sq Ft
$143/Sq Ft
Est. Value
About This Home
This home is located at 971 Winsome Rd, North Fort Myers, FL 33903 and is currently estimated at $285,237, approximately $142 per square foot. 971 Winsome Rd is a home located in Lee County with nearby schools including Tropic Isles Elementary School, Hancock Creek Elementary School, and Caloosa Elementary School.
Ownership History
Date
Name
Owned For
Owner Type
Purchase Details
Closed on
Jun 16, 2021
Sold by
True North Property Owner A Llc
Bought by
True North Property Owner A Llc
Current Estimated Value
Purchase Details
Closed on
May 23, 2019
Sold by
Pmc Sfr Holding Llc
Bought by
Pmc Sfr Borrower Llc
Purchase Details
Closed on
Mar 14, 2018
Sold by
Wilmington Saving Fund Society
Bought by
Pmc Sfr Holding Llc
Purchase Details
Closed on
May 16, 2013
Sold by
Liston Elaine
Bought by
Toliver Tabitha
Purchase Details
Closed on
Jan 31, 2003
Sold by
Hayes Blaine
Bought by
Liston Elaine
Purchase Details
Closed on
Oct 26, 2000
Sold by
Montez Ramiro H and Montez Cynthia S
Bought by
Hayes Blaine and Liston Elaine
Home Financials for this Owner
Home Financials are based on the most recent Mortgage that was taken out on this home.
Original Mortgage
$80,337
Interest Rate
7.93%
Mortgage Type
FHA
Create a Home Valuation Report for This Property
The Home Valuation Report is an in-depth analysis detailing your home's value as well as a comparison with similar homes in the area
Home Values in the Area
Average Home Value in this Area
Purchase History
| Date | Buyer | Sale Price | Title Company |
|---|---|---|---|
| True North Property Owner A Llc | -- | Selene Title Llc | |
| Pmc Sfr Borrower Llc | -- | Os National Llc | |
| Pmc Sfr Holding Llc | -- | Os National Llc | |
| Toliver Tabitha | -- | None Available | |
| Liston Elaine | -- | -- | |
| Hayes Blaine | $81,000 | -- |
Source: Public Records
Mortgage History
| Date | Status | Borrower | Loan Amount |
|---|---|---|---|
| Previous Owner | Hayes Blaine | $80,337 |
Source: Public Records
Tax History Compared to Growth
Tax History
| Year | Tax Paid | Tax Assessment Tax Assessment Total Assessment is a certain percentage of the fair market value that is determined by local assessors to be the total taxable value of land and additions on the property. | Land | Improvement |
|---|---|---|---|---|
| 2025 | $3,656 | $229,190 | $33,108 | $152,882 |
| 2024 | $3,456 | $209,404 | -- | -- |
| 2023 | $3,456 | $190,367 | $0 | $0 |
| 2022 | $3,474 | $212,356 | $25,839 | $186,517 |
| 2021 | $2,676 | $157,328 | $21,100 | $136,228 |
| 2020 | $2,566 | $146,958 | $16,688 | $130,270 |
| 2019 | $2,357 | $133,230 | $6,608 | $126,622 |
| 2018 | $2,119 | $116,274 | $6,608 | $109,666 |
| 2017 | $2,387 | $130,008 | $6,608 | $123,400 |
| 2016 | $906 | $88,623 | $7,219 | $81,404 |
| 2015 | $911 | $76,096 | $6,258 | $69,838 |
| 2014 | $891 | $70,806 | $6,208 | $64,598 |
| 2013 | -- | $62,901 | $5,436 | $57,465 |
Source: Public Records
Map
Nearby Homes
- 0 Happy Dale Rd Unit 2025008482
- 935 Hearty St
- 947 Jolly Rd
- 1082 Ridgeway Dr
- 888 Ridgeway Dr
- 1010 Tropic Terrace
- 1003 Tropic Terrace
- 4777 Orange Grove Blvd Unit 5
- 13451 Fern Trail Dr
- 4380 Saint Clair Ave W
- 302 NE 24th Ave
- 2106 NE 24th Ave
- 927 Coconut Dr
- 4344 Saint Clair Ave W
- 1429 Tropic Terrace
- 1409 Tropic Terrace
- 1418 Tropic Terrace
- 1432 Tropic Terrace Unit PS32
- 1416 Tropic Terrace
- 5905 Untermeyer Ct