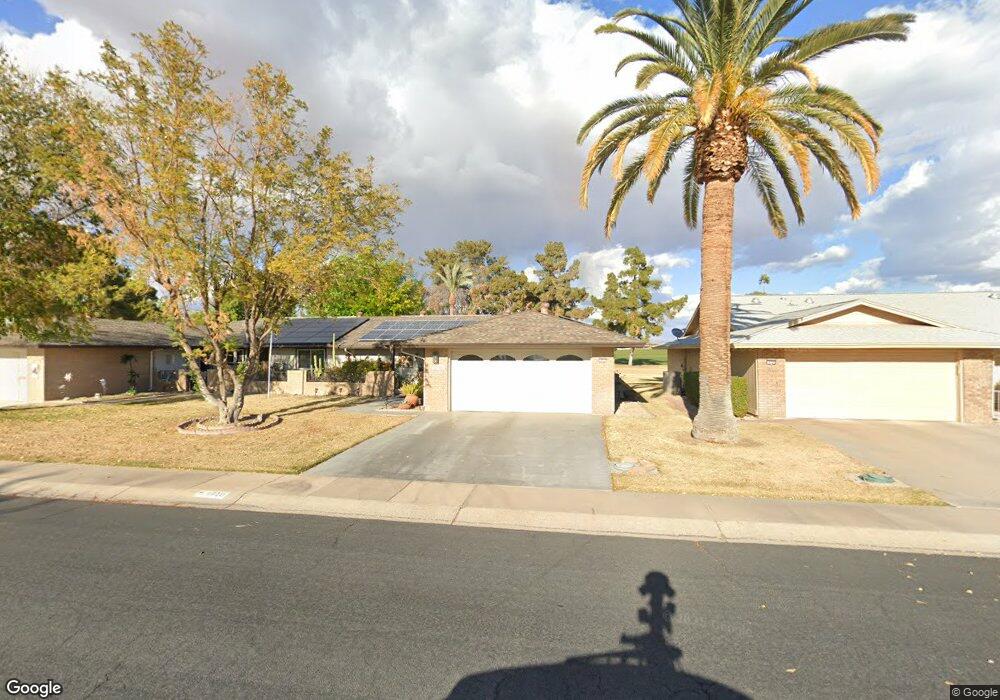
9710 W Oak Ridge Dr Sun City, AZ 85351
Estimated Value: $245,265 - $320,000
2
Beds
2
Baths
1,658
Sq Ft
$174/Sq Ft
Est. Value
About This Home
This home is located at 9710 W Oak Ridge Dr, Sun City, AZ 85351 and is currently estimated at $288,316, approximately $173 per square foot. 9710 W Oak Ridge Dr is a home located in Maricopa County with nearby schools including Sonoran Science Academy-Peoria, Black Mountain Science Academy Montessori, and Arrowhead Montessori.
Ownership History
Date
Name
Owned For
Owner Type
Purchase Details
Closed on
Oct 3, 2023
Sold by
Carroll R Nuckolls R and Carroll Dotty E
Bought by
Shrable Dotty E
Current Estimated Value
Purchase Details
Closed on
Mar 5, 2020
Sold by
Shrable Dotty E and Shrable Dotty
Bought by
Nuckolls Carrol R and Nuckolls Carroll R
Purchase Details
Closed on
Aug 28, 2018
Sold by
Koemptgen Joan Y Barry and Joan Y Barry Koemptgen Trust
Bought by
Shrable Dotty
Purchase Details
Closed on
Jun 3, 2004
Sold by
Koemptgen Joan Y Barry
Bought by
Koemptgen Joan Y Barry and The Joan Y Barry Koemptgen Trust
Purchase Details
Closed on
Apr 26, 2004
Sold by
Koemptgen Joan Y Barry
Bought by
Koemptgen Joan Y Barry and Joan Y Barry Koemptgen Trust
Purchase Details
Closed on
Mar 24, 2004
Sold by
Whalen Margaret L
Bought by
Koemptgen Joan Y Barry
Create a Home Valuation Report for This Property
The Home Valuation Report is an in-depth analysis detailing your home's value as well as a comparison with similar homes in the area
Home Values in the Area
Average Home Value in this Area
Purchase History
| Date | Buyer | Sale Price | Title Company |
|---|---|---|---|
| Shrable Dotty E | -- | None Listed On Document | |
| Nuckolls Carrol R | -- | None Available | |
| Shrable Dotty | $200,000 | First American Title Insuran | |
| Koemptgen Joan Y Barry | -- | Capital Title Agency Inc | |
| Koemptgen Joan Y Barry | -- | Capital Title Agency Inc | |
| Koemptgen Joan Y Barry | $139,500 | Capital Title Agency Inc |
Source: Public Records
Tax History Compared to Growth
Tax History
| Year | Tax Paid | Tax Assessment Tax Assessment Total Assessment is a certain percentage of the fair market value that is determined by local assessors to be the total taxable value of land and additions on the property. | Land | Improvement |
|---|---|---|---|---|
| 2025 | $1,381 | $17,240 | -- | -- |
| 2024 | $1,242 | $16,419 | -- | -- |
| 2023 | $1,242 | $23,620 | $4,720 | $18,900 |
| 2022 | $1,171 | $19,520 | $3,900 | $15,620 |
| 2021 | $1,209 | $18,260 | $3,650 | $14,610 |
| 2020 | $1,176 | $16,970 | $3,390 | $13,580 |
| 2019 | $1,165 | $15,620 | $3,120 | $12,500 |
| 2018 | $1,114 | $14,220 | $2,840 | $11,380 |
| 2017 | $1,072 | $11,920 | $2,380 | $9,540 |
| 2016 | $1,009 | $11,510 | $2,300 | $9,210 |
| 2015 | $960 | $11,460 | $2,290 | $9,170 |
Source: Public Records
Map
Nearby Homes
- 9705 W Oak Ridge Dr
- 9625 W Oak Ridge Dr Unit 26
- 9805 W Burns Dr
- 9814 W Gulf Hills Dr
- 9701 W Shasta Dr
- 9821 W Pleasant Valley Rd
- 15602 N Lakeforest Dr
- 9814 W Shasta Dr
- 15462 N Lakeforest Dr
- 9501 W Oak Ridge Dr
- 9606 W Long Hills Dr
- 9814 W Long Hills Dr Unit 26
- 9502 W Shasta Dr Unit 26
- 9525 W Cedar Hill Cir
- 9437 W Long Hills Dr
- 9326 W Briarwood Cir
- 10018 W Burns Dr
- 9414 W Greenway Rd
- 15205 N Desert Rose Dr
- 9433 W Greenway Rd
- 9714 W Oak Ridge Dr
- 9706 W Oak Ridge Dr
- 9702 W Oak Ridge Dr
- 9718 W Oak Ridge Dr
- 9722 W Oak Ridge Dr
- 9709 W Oak Ridge Dr
- 9638 W Oak Ridge Dr
- 9713 W Oak Ridge Dr
- 9634 W Oak Ridge Dr
- 9637 W Oak Ridge Dr
- 9726 W Oak Ridge Dr
- 9729 W Oak Ridge Dr
- 9630 W Oak Ridge Dr
- 9734 W Gulf Hills Dr
- 9730 W Oak Ridge Dr
- 9633 W Oak Ridge Dr Unit DR
- 9633 W Oak Ridge Dr
- 9726 W Gulf Hills Dr
- 9738 W Gulf Hills Dr
- 9626 W Oak Ridge Dr