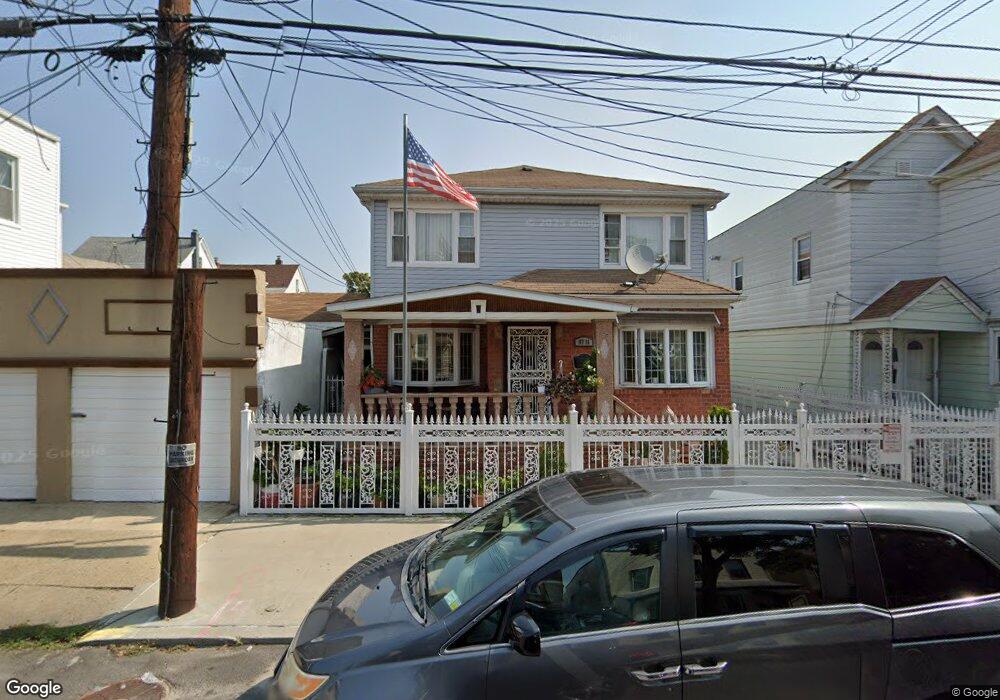
9711 89th St Ozone Park, NY 11416
Ozone Park NeighborhoodEstimated Value: $799,375 - $925,000
--
Bed
--
Bath
1,664
Sq Ft
$530/Sq Ft
Est. Value
About This Home
This home is located at 9711 89th St, Ozone Park, NY 11416 and is currently estimated at $881,594, approximately $529 per square foot. 9711 89th St is a home located in Queens County with nearby schools including New York City Academy For Discovery, Santiam Elementary School, and Jhs 210 Elizabeth Blackwell.
Ownership History
Date
Name
Owned For
Owner Type
Purchase Details
Closed on
Dec 31, 2011
Sold by
Kassim Zaleena and Nohar Bibi Sharizia
Bought by
Alli Bibi Fareeda and Kassim Zaleena
Current Estimated Value
Purchase Details
Closed on
Apr 28, 2006
Sold by
Nohar Bibi-Sharizia and Sukhu Khairule-Nesh
Bought by
Kassim Zaleena and Nohar Sharizia
Purchase Details
Closed on
Oct 28, 1998
Sold by
Rahman Shamsur and Rahman Shamsun N
Bought by
Sukhu Khairule Nesh and Nohar Bibi Sharizia
Create a Home Valuation Report for This Property
The Home Valuation Report is an in-depth analysis detailing your home's value as well as a comparison with similar homes in the area
Home Values in the Area
Average Home Value in this Area
Purchase History
| Date | Buyer | Sale Price | Title Company |
|---|---|---|---|
| Alli Bibi Fareeda | -- | -- | |
| Alli Bibi Fareeda | -- | -- | |
| Kassim Zaleena | -- | -- | |
| Kassim Zaleena | -- | -- | |
| Sukhu Khairule Nesh | $252,000 | First American Title Ins Co | |
| Sukhu Khairule Nesh | $252,000 | First American Title Ins Co |
Source: Public Records
Tax History Compared to Growth
Tax History
| Year | Tax Paid | Tax Assessment Tax Assessment Total Assessment is a certain percentage of the fair market value that is determined by local assessors to be the total taxable value of land and additions on the property. | Land | Improvement |
|---|---|---|---|---|
| 2025 | $8,722 | $45,908 | $14,916 | $30,992 |
| 2024 | $8,722 | $43,427 | $15,600 | $27,827 |
| 2023 | $8,345 | $41,088 | $16,109 | $24,979 |
| 2022 | $7,488 | $46,380 | $17,760 | $28,620 |
| 2021 | $8,344 | $45,360 | $17,760 | $27,600 |
| 2020 | $8,098 | $43,740 | $17,760 | $25,980 |
| 2019 | $7,570 | $48,180 | $17,760 | $30,420 |
| 2018 | $6,980 | $34,240 | $14,520 | $19,720 |
| 2017 | $6,735 | $33,040 | $14,051 | $18,989 |
| 2016 | $6,605 | $33,040 | $14,051 | $18,989 |
| 2015 | $3,540 | $31,881 | $17,868 | $14,013 |
| 2014 | $3,540 | $30,158 | $17,942 | $12,216 |
Source: Public Records
Map
Nearby Homes