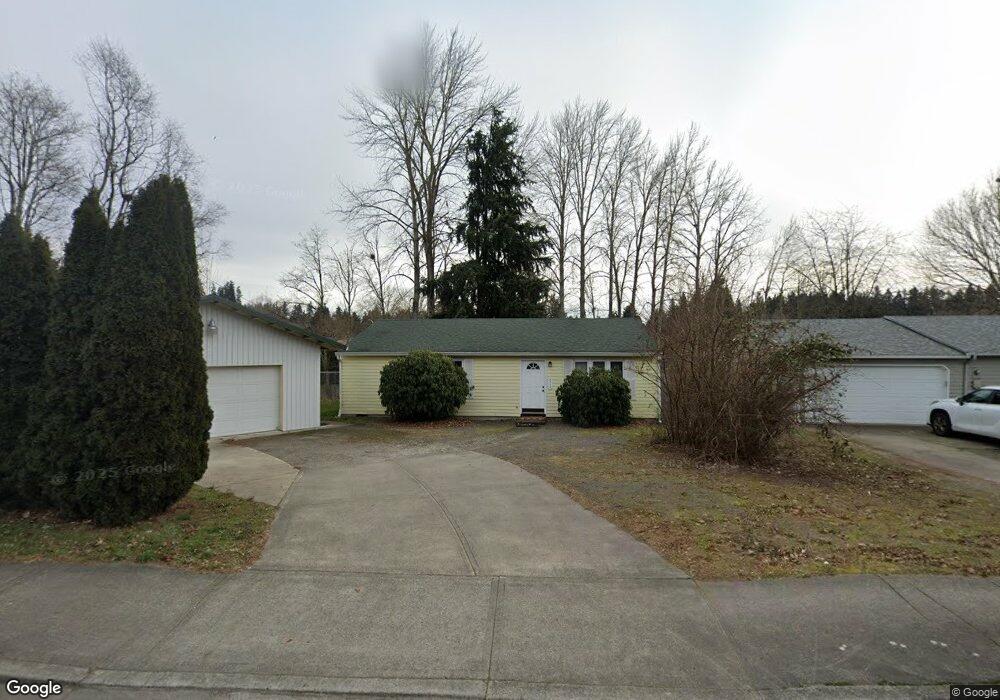
9713 NE Burton Rd Vancouver, WA 98662
Burton Ridge NeighborhoodEstimated Value: $414,000 - $453,000
3
Beds
1
Bath
1,120
Sq Ft
$381/Sq Ft
Est. Value
About This Home
This home is located at 9713 NE Burton Rd, Vancouver, WA 98662 and is currently estimated at $427,260, approximately $381 per square foot. 9713 NE Burton Rd is a home located in Clark County with nearby schools including Fircrest Elementary School, Cascade Middle School, and Evergreen High School.
Ownership History
Date
Name
Owned For
Owner Type
Purchase Details
Closed on
Jul 22, 2016
Sold by
Bassett Richard D and Phipps Janae C
Bought by
Phipps Jane C
Current Estimated Value
Purchase Details
Closed on
Sep 30, 2010
Sold by
Hsbc Bank Usa National Association
Bought by
Bassett Richard D and Phipps Janae C
Purchase Details
Closed on
Dec 21, 2009
Sold by
Thomas Eric A
Bought by
Hsbc Bank Usa National Association
Purchase Details
Closed on
Jun 13, 2001
Sold by
Davis William Byron and Davis Janice A
Bought by
Thomas Eric A
Purchase Details
Closed on
Aug 11, 2000
Sold by
Providian National Bank
Bought by
Davis William Byron
Purchase Details
Closed on
Jun 30, 2000
Sold by
Baker Robert Paul and Baker Judy Kay
Bought by
Providian National Bank
Purchase Details
Closed on
Dec 28, 1999
Sold by
Baker Paul
Bought by
Baker Judy Kay
Create a Home Valuation Report for This Property
The Home Valuation Report is an in-depth analysis detailing your home's value as well as a comparison with similar homes in the area
Home Values in the Area
Average Home Value in this Area
Purchase History
| Date | Buyer | Sale Price | Title Company |
|---|---|---|---|
| Phipps Jane C | -- | None Available | |
| Bassett Richard D | $87,500 | Chicago Title Insurance Comp | |
| Hsbc Bank Usa National Association | $142,500 | None Available | |
| Thomas Eric A | -- | Washington Title Company | |
| Davis William Byron | -- | Chicago Title Insurance Co | |
| Providian National Bank | $16,366 | First American Title | |
| Baker Judy Kay | -- | -- |
Source: Public Records
Tax History Compared to Growth
Tax History
| Year | Tax Paid | Tax Assessment Tax Assessment Total Assessment is a certain percentage of the fair market value that is determined by local assessors to be the total taxable value of land and additions on the property. | Land | Improvement |
|---|---|---|---|---|
| 2025 | $3,719 | $367,846 | $171,350 | $196,496 |
| 2024 | $3,555 | $374,675 | $171,350 | $203,325 |
| 2023 | $3,423 | $371,469 | $171,350 | $200,119 |
| 2022 | $3,074 | $353,495 | $171,350 | $182,145 |
| 2021 | $2,807 | $301,039 | $145,000 | $156,039 |
| 2020 | $2,585 | $259,797 | $112,000 | $147,797 |
| 2019 | $2,258 | $241,609 | $96,600 | $145,009 |
| 2018 | $2,470 | $227,217 | $0 | $0 |
| 2017 | $2,187 | $199,818 | $0 | $0 |
| 2016 | $2,041 | $183,160 | $0 | $0 |
| 2015 | $1,883 | $163,688 | $0 | $0 |
| 2014 | -- | $144,365 | $0 | $0 |
| 2013 | -- | $124,989 | $0 | $0 |
Source: Public Records
Map
Nearby Homes
- 2305 NE 94th Ct
- 2017 NE 96th Ct
- 9208 NE 27th St
- 10303 NE 22nd St
- 10402 NE 21st St
- 1903 NE 104th Ave
- 9910 NE 15th St
- 9511 NE Pinecreek St
- 1421 NE 100th Ave
- 1604 NE 91st Ave
- 9818 NE 14th St
- 1904 NE 107th Ave
- 10605 NE 19th St
- 2016 NE 87th Ave
- 3517 NE 102nd Ct
- 1411 NE 90th Ave
- 8503 NE 25th St
- 8702 NE 17th St Unit 61
- 2010 NE 111th Ct
- 8803 NE 14th St
- 9705 NE Burton Rd
- 2300 NE 98th Ave
- 2214 NE 98th Ave
- 2308 NE 98th Ave
- 9701 NE Burton Rd
- 2311 NE 96th Ct
- 2208 NE 98th Ave
- 9616 NE Burton Rd
- 2305 NE 96th Ct
- 2317 NE 96th Ct
- 9710 NE 22nd Cir
- 2416 NE 98th Ave
- 0 NE Burton and 86th Ave
- 2202 NE 98th Ave
- 9706 NE 22nd Cir
- 2411 NE 96th Ave
- 9702 NE Burton Rd
- 2207 NE 98th Ave
- 2217 NE 96th Ct
- 2504 NE 98th Ave