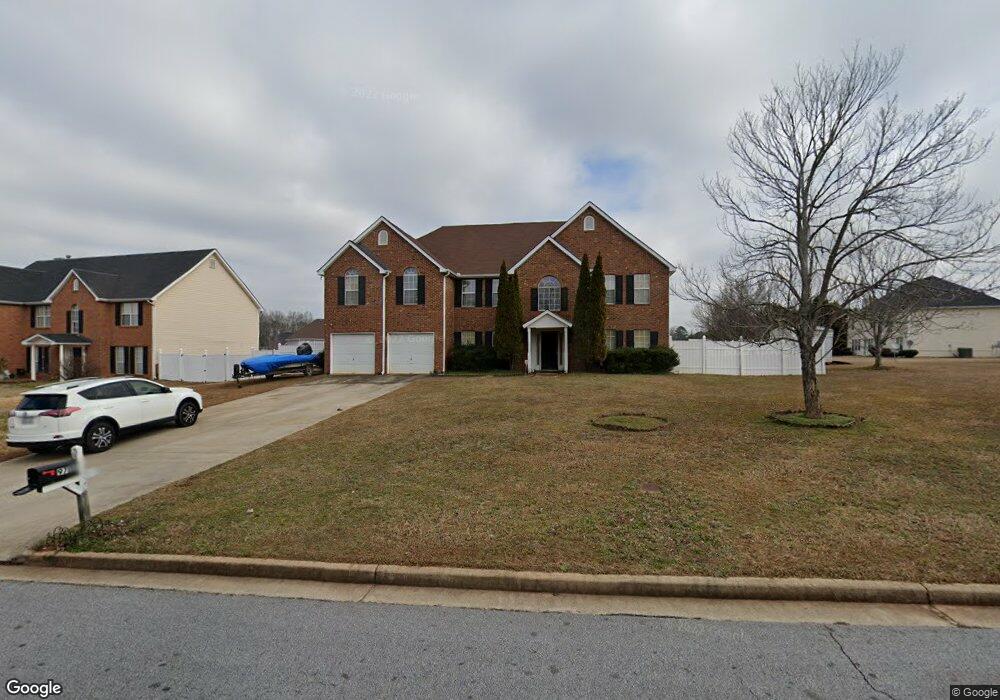
9714 Tyler Terrace Jonesboro, GA 30238
Estimated Value: $369,811 - $415,000
5
Beds
4
Baths
3,591
Sq Ft
$108/Sq Ft
Est. Value
About This Home
This home is located at 9714 Tyler Terrace, Jonesboro, GA 30238 and is currently estimated at $388,953, approximately $108 per square foot. 9714 Tyler Terrace is a home located in Clayton County with nearby schools including Brown Elementary School, Mundys Mill Middle School, and Mundy's Mill High School.
Ownership History
Date
Name
Owned For
Owner Type
Purchase Details
Closed on
Apr 28, 2025
Sold by
Choeun Anna
Bought by
Var 4
Current Estimated Value
Purchase Details
Closed on
Oct 22, 2007
Sold by
Set Sokha
Bought by
I8v Var and Choeun Anna
Home Financials for this Owner
Home Financials are based on the most recent Mortgage that was taken out on this home.
Original Mortgage
$200,450
Interest Rate
6.02%
Mortgage Type
New Conventional
Purchase Details
Closed on
Oct 22, 2001
Sold by
Sao Savy
Bought by
Sao Savy and Sao Ny
Home Financials for this Owner
Home Financials are based on the most recent Mortgage that was taken out on this home.
Original Mortgage
$159,200
Interest Rate
6.6%
Mortgage Type
New Conventional
Purchase Details
Closed on
Jul 9, 1999
Sold by
First Dimension Homes Inc
Bought by
Ballard Tony D and Ballard Kim
Home Financials for this Owner
Home Financials are based on the most recent Mortgage that was taken out on this home.
Original Mortgage
$164,150
Interest Rate
7.7%
Mortgage Type
FHA
Create a Home Valuation Report for This Property
The Home Valuation Report is an in-depth analysis detailing your home's value as well as a comparison with similar homes in the area
Home Values in the Area
Average Home Value in this Area
Purchase History
| Date | Buyer | Sale Price | Title Company |
|---|---|---|---|
| Var 4 | $339,000 | -- | |
| I8v Var | $211,000 | -- | |
| Sao Savy | -- | -- | |
| Sao Savy | $183,000 | -- | |
| Ballard Tony D | $164,300 | -- |
Source: Public Records
Mortgage History
| Date | Status | Borrower | Loan Amount |
|---|---|---|---|
| Previous Owner | I8v Var | $200,450 | |
| Previous Owner | Sao Savy | $159,200 | |
| Previous Owner | Ballard Tony D | $164,150 |
Source: Public Records
Tax History Compared to Growth
Tax History
| Year | Tax Paid | Tax Assessment Tax Assessment Total Assessment is a certain percentage of the fair market value that is determined by local assessors to be the total taxable value of land and additions on the property. | Land | Improvement |
|---|---|---|---|---|
| 2024 | $4,933 | $135,480 | $9,600 | $125,880 |
| 2023 | $4,892 | $135,480 | $9,600 | $125,880 |
| 2022 | $3,977 | $110,360 | $9,600 | $100,760 |
| 2021 | $3,138 | $88,480 | $9,600 | $78,880 |
| 2020 | $3,035 | $84,946 | $9,600 | $75,346 |
| 2019 | $2,621 | $73,632 | $8,800 | $64,832 |
| 2018 | $2,646 | $74,245 | $8,800 | $65,445 |
| 2017 | $2,284 | $65,195 | $8,800 | $56,395 |
| 2016 | $2,180 | $62,633 | $8,800 | $53,833 |
| 2015 | $2,409 | $0 | $0 | $0 |
| 2014 | $2,217 | $64,778 | $8,800 | $55,978 |
Source: Public Records
Map
Nearby Homes
- 9725 Tyler Terrace Unit 1
- 157 Tyler Ridge Unit II
- 0 Highway 54 Unit 10613856
- 9941 Musket Ridge Cir
- 230 Blue Heron Dr
- 9579 Fayetteville Rd
- 9579 Highway 54 W
- 9550 Canvasback Ct
- 9542 Canvasback Ct
- 9541 Canvasback Ct
- 226 Woodwind Way
- 9716 Holly Hill Way
- 304 Deerfield Dr
- 90 Inverness Trace
- 9430 Sleepy Hollow Ln
- 155 Millers Oak Way
- 281 Willow Springs Dr
- 247 Water Oak Ln
- 288 Country Club Dr
- 9404 Cypress Ln
- 9706 Tyler Terrace Unit 1
- 256 Ethan Moor
- 0 Tyler Terrace Unit 8249802
- 0 Tyler Terrace Unit 8329496
- 0 Tyler Terrace Unit 8012381
- 0 Tyler Terrace Unit 8530012
- 0 Tyler Terrace Unit 8514225
- 0 Tyler Terrace Unit 8258260
- 0 Tyler Terrace Unit 8748252
- 0 Tyler Terrace Unit 8823783
- 0 Tyler Terrace Unit 3146731
- 0 Tyler Terrace Unit 7125662
- 0 Tyler Terrace Unit 7353645
- 0 Tyler Terrace
- 264 Ethan Moor Unit 1
- 45 Tyler Ridge
- 55 Tyler Ridge
- 9698 Tyler Terrace Unit 1
- 63 Tyler Ridge
- 9717 Tyler Terrace