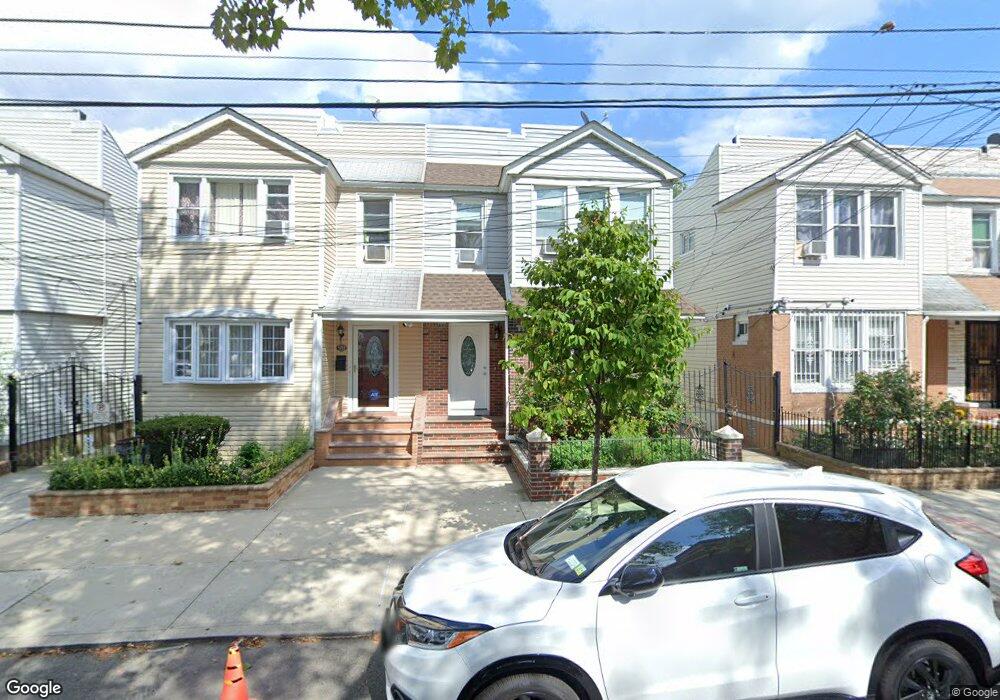
9715 83rd St Ozone Park, NY 11416
Ozone Park NeighborhoodEstimated Value: $778,474 - $1,069,000
Studio
--
Bath
1,920
Sq Ft
$499/Sq Ft
Est. Value
About This Home
This home is located at 9715 83rd St, Ozone Park, NY 11416 and is currently estimated at $958,369, approximately $499 per square foot. 9715 83rd St is a home located in Queens County with nearby schools including P.S. 64 - Joseph P. Addabbo, Jhs 210 Elizabeth Blackwell, and Divine Mercy Catholic Academy.
Ownership History
Date
Name
Owned For
Owner Type
Purchase Details
Closed on
May 26, 2004
Sold by
Kalicharan Charran
Bought by
Kalicharan Charran and Kalicharan Lelly
Current Estimated Value
Purchase Details
Closed on
Sep 11, 1998
Sold by
Williams Bernard and Ramsingh Debbie C
Bought by
Kalicharan Charran
Home Financials for this Owner
Home Financials are based on the most recent Mortgage that was taken out on this home.
Original Mortgage
$163,800
Interest Rate
10.62%
Create a Home Valuation Report for This Property
The Home Valuation Report is an in-depth analysis detailing your home's value as well as a comparison with similar homes in the area
Home Values in the Area
Average Home Value in this Area
Purchase History
| Date | Buyer | Sale Price | Title Company |
|---|---|---|---|
| Kalicharan Charran | -- | -- | |
| Kalicharan Charran | -- | -- | |
| Kalicharan Charran | $182,000 | Stewart Title | |
| Kalicharan Charran | $182,000 | Stewart Title |
Source: Public Records
Mortgage History
| Date | Status | Borrower | Loan Amount |
|---|---|---|---|
| Previous Owner | Kalicharan Charran | $163,800 | |
| Closed | Kalicharan Charran | $0 |
Source: Public Records
Tax History
| Year | Tax Paid | Tax Assessment Tax Assessment Total Assessment is a certain percentage of the fair market value that is determined by local assessors to be the total taxable value of land and additions on the property. | Land | Improvement |
|---|---|---|---|---|
| 2025 | $7,323 | $38,648 | $12,117 | $26,531 |
| 2024 | $7,323 | $36,461 | $10,743 | $25,718 |
| 2023 | $7,219 | $35,942 | $11,705 | $24,237 |
| 2022 | $7,153 | $48,780 | $16,140 | $32,640 |
| 2021 | $7,185 | $46,740 | $16,140 | $30,600 |
| 2020 | $6,817 | $43,380 | $16,140 | $27,240 |
| 2019 | $6,356 | $44,580 | $16,140 | $28,440 |
| 2018 | $6,106 | $29,952 | $13,796 | $16,156 |
| 2017 | $6,087 | $29,859 | $15,098 | $14,761 |
| 2016 | $5,687 | $29,859 | $15,098 | $14,761 |
| 2015 | $3,397 | $26,839 | $15,986 | $10,853 |
| 2014 | $3,397 | $25,320 | $17,940 | $7,380 |
Source: Public Records
Map
Nearby Homes
Your Personal Tour Guide
Ask me questions while you tour the home.