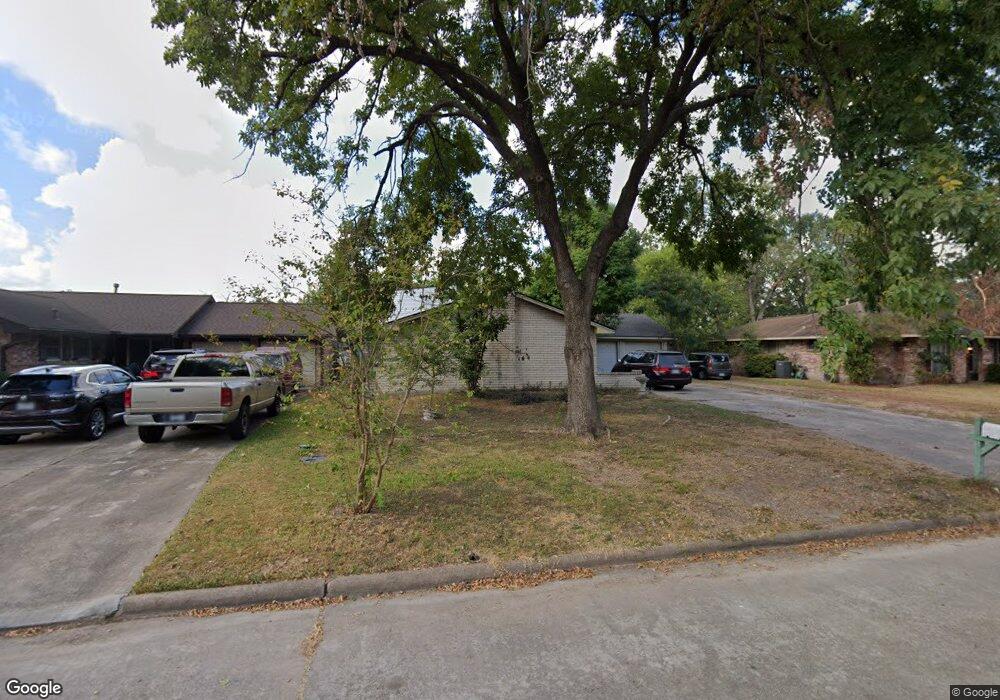
9715 Deanwood St Houston, TX 77040
Greater Inwood NeighborhoodEstimated Value: $263,000 - $276,000
4
Beds
3
Baths
2,030
Sq Ft
$133/Sq Ft
Est. Value
About This Home
This home is located at 9715 Deanwood St, Houston, TX 77040 and is currently estimated at $270,384, approximately $133 per square foot. 9715 Deanwood St is a home located in Harris County with nearby schools including Edward a Vines EC/Pre-K/K School, Ermel Elementary School, and Dr. Viola K. Garcia Middle School.
Ownership History
Date
Name
Owned For
Owner Type
Purchase Details
Closed on
Sep 17, 2025
Sold by
Guevara Jose F Perez
Bought by
Guevara Jose F Perez and Sanchez Olga Lidia
Current Estimated Value
Purchase Details
Closed on
Jan 30, 2015
Sold by
Andolina Samuel F and Andolina Guadalupe R
Bought by
Vaquera Adriana
Home Financials for this Owner
Home Financials are based on the most recent Mortgage that was taken out on this home.
Original Mortgage
$109,479
Interest Rate
4.37%
Mortgage Type
FHA
Purchase Details
Closed on
Dec 8, 2000
Sold by
Mcginnis Daniel G and Mcginnis Carrie
Bought by
Andolina Samuel F and Andolina Guadalupe R
Home Financials for this Owner
Home Financials are based on the most recent Mortgage that was taken out on this home.
Original Mortgage
$72,597
Interest Rate
7.72%
Mortgage Type
FHA
Create a Home Valuation Report for This Property
The Home Valuation Report is an in-depth analysis detailing your home's value as well as a comparison with similar homes in the area
Home Values in the Area
Average Home Value in this Area
Purchase History
| Date | Buyer | Sale Price | Title Company |
|---|---|---|---|
| Guevara Jose F Perez | -- | None Listed On Document | |
| Vaquera Adriana | -- | None Available | |
| Andolina Samuel F | -- | Fidelity National Title |
Source: Public Records
Mortgage History
| Date | Status | Borrower | Loan Amount |
|---|---|---|---|
| Previous Owner | Vaquera Adriana | $109,479 | |
| Previous Owner | Andolina Samuel F | $72,597 |
Source: Public Records
Tax History Compared to Growth
Tax History
| Year | Tax Paid | Tax Assessment Tax Assessment Total Assessment is a certain percentage of the fair market value that is determined by local assessors to be the total taxable value of land and additions on the property. | Land | Improvement |
|---|---|---|---|---|
| 2025 | $6,389 | $288,322 | $42,038 | $246,284 |
| 2024 | $6,389 | $281,499 | $40,036 | $241,463 |
| 2023 | $6,389 | $274,389 | $40,036 | $234,353 |
| 2022 | $5,489 | $228,823 | $34,031 | $194,792 |
| 2021 | $4,972 | $197,944 | $34,031 | $163,913 |
| 2020 | $4,914 | $186,178 | $16,682 | $169,496 |
| 2019 | $4,736 | $171,138 | $16,682 | $154,456 |
| 2018 | $2,152 | $149,864 | $16,682 | $133,182 |
| 2017 | $3,976 | $149,864 | $16,682 | $133,182 |
| 2016 | $3,391 | $127,838 | $16,682 | $111,156 |
| 2015 | $1,953 | $119,257 | $16,682 | $102,575 |
| 2014 | $1,953 | $89,340 | $16,682 | $72,658 |
Source: Public Records
Map
Nearby Homes
- 9523 Vanwood St
- 7706 Deadwood Dr
- 7606 Battlepine Dr
- 7731 Deadwood Dr
- 7051 Majestic Oaks Dr
- 7210 Lumber Jack Dr
- 9350 Guywood St
- 9331 Deanwood St
- 7707 Lumber Jack Dr
- 7322 Sawmill Trail
- 7803 Yellow Pine Dr
- 7823 Lumber Jack Dr
- 7410 Log Hollow Dr
- 10126 Pine Moss Dr
- 7727 Log Hollow Dr
- 7718 Breezeway St
- 7911 Battleoak Dr
- 7918 Battleoak Dr
- 10143 Inwood Hollow Ln
- 7318 Shady Grove Ln
- 9711 Deanwood St
- 9719 Deanwood St
- 9707 Deanwood St
- 9803 Deanwood St
- 9714 Jaywood Dr
- 9807 Deanwood St
- 9710 Jaywood Dr
- 9718 Jaywood Dr
- 9714 Deanwood St
- 9706 Jaywood Dr
- 9703 Deanwood St
- 9710 Deanwood St
- 9802 Jaywood Dr
- 9802 Deanwood St
- 9811 Deanwood St
- 9706 Deanwood St
- 9806 Jaywood Dr
- 9806 Deanwood St
- 9702 Jaywood Dr
- 9815 Deanwood St