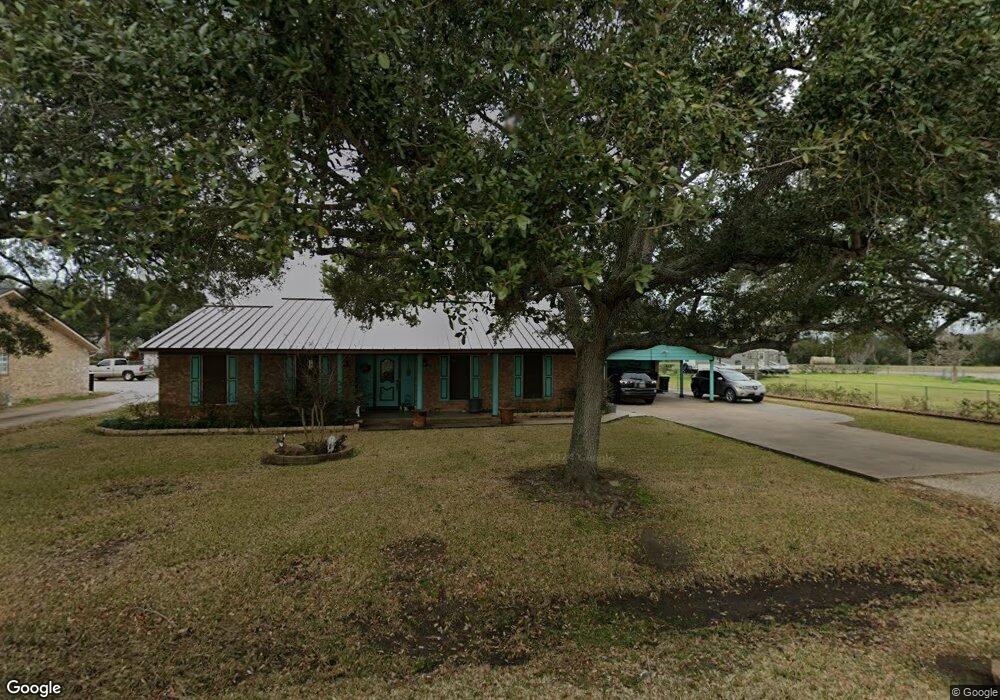
9715 Gene St Needville, TX 77461
Estimated Value: $291,000 - $342,000
3
Beds
2
Baths
1,793
Sq Ft
$180/Sq Ft
Est. Value
About This Home
This home is located at 9715 Gene St, Needville, TX 77461 and is currently estimated at $323,272, approximately $180 per square foot. 9715 Gene St is a home located in Fort Bend County with nearby schools including Needville Elementary School, Needville Junior High School, and Needville Middle School.
Ownership History
Date
Name
Owned For
Owner Type
Purchase Details
Closed on
Sep 28, 2006
Sold by
Cox Kevin
Bought by
Krejci George H and Krejci Melody L
Current Estimated Value
Home Financials for this Owner
Home Financials are based on the most recent Mortgage that was taken out on this home.
Original Mortgage
$30,400
Interest Rate
6.51%
Mortgage Type
Purchase Money Mortgage
Purchase Details
Closed on
Feb 27, 2004
Sold by
Mund Kimberly M and Walling Glynn
Bought by
Cox Kevin
Home Financials for this Owner
Home Financials are based on the most recent Mortgage that was taken out on this home.
Original Mortgage
$123,600
Interest Rate
5.67%
Mortgage Type
Purchase Money Mortgage
Purchase Details
Closed on
Dec 13, 2000
Sold by
Mund Tim Anthony
Bought by
Mund Kimberly Marie
Purchase Details
Closed on
Mar 9, 1999
Sold by
Mund Tim and Mund Kimberly Marie
Bought by
Slawinski J Stacy and Slawinski Stephanie
Create a Home Valuation Report for This Property
The Home Valuation Report is an in-depth analysis detailing your home's value as well as a comparison with similar homes in the area
Home Values in the Area
Average Home Value in this Area
Purchase History
| Date | Buyer | Sale Price | Title Company |
|---|---|---|---|
| Krejci George H | -- | Stewart Title Richmond | |
| Cox Kevin | -- | Startex Title | |
| Krejci George H | -- | -- | |
| Mund Kimberly Marie | -- | -- | |
| Slawinski J Stacy | -- | American Title Co |
Source: Public Records
Mortgage History
| Date | Status | Borrower | Loan Amount |
|---|---|---|---|
| Closed | Krejci George H | $30,400 | |
| Previous Owner | Krejci George H | $123,600 | |
| Closed | Mund Kimberly Marie | $0 | |
| Closed | Krejci George H | $23,150 |
Source: Public Records
Tax History Compared to Growth
Tax History
| Year | Tax Paid | Tax Assessment Tax Assessment Total Assessment is a certain percentage of the fair market value that is determined by local assessors to be the total taxable value of land and additions on the property. | Land | Improvement |
|---|---|---|---|---|
| 2025 | $3,403 | $330,074 | $86,153 | $243,921 |
| 2024 | $3,403 | $322,441 | $49,567 | $272,874 |
| 2023 | $3,798 | $293,128 | $16,673 | $276,455 |
| 2022 | $4,819 | $266,480 | $0 | $306,120 |
| 2021 | $5,461 | $242,250 | $86,150 | $156,100 |
| 2020 | $5,242 | $220,230 | $86,150 | $134,080 |
| 2019 | $5,136 | $200,210 | $84,050 | $116,160 |
| 2018 | $4,627 | $182,010 | $45,180 | $136,830 |
| 2017 | $4,515 | $177,000 | $45,180 | $131,820 |
| 2016 | $4,535 | $177,750 | $45,180 | $132,570 |
| 2015 | $3,760 | $167,940 | $45,180 | $122,760 |
| 2014 | $3,799 | $161,830 | $45,180 | $116,650 |
Source: Public Records
Map
Nearby Homes
- 14210 Cally Cir
- 10010 Texas 36
- 3002 Caroline St
- 3819 Willow Breeze
- 3811 Candlewood Cir
- 3818 Founders Dr
- 3803 Doveswood Cir
- 3339 Terry St
- 14234 Hay Meadow Ln
- 14238 Hay Meadow Ln
- 0 Colony Rd
- 3118 Violet St
- 3814 Doveswood Cir
- 14210 Hay Meadow Ln
- 14218 Golden Wheat Ln
- 3003 Violet St
- Creede Plan at Harvest Pointe
- San Marcos Plan at Harvest Pointe
- Aquila Plan at Harvest Pointe
- Boise Plan at Harvest Pointe