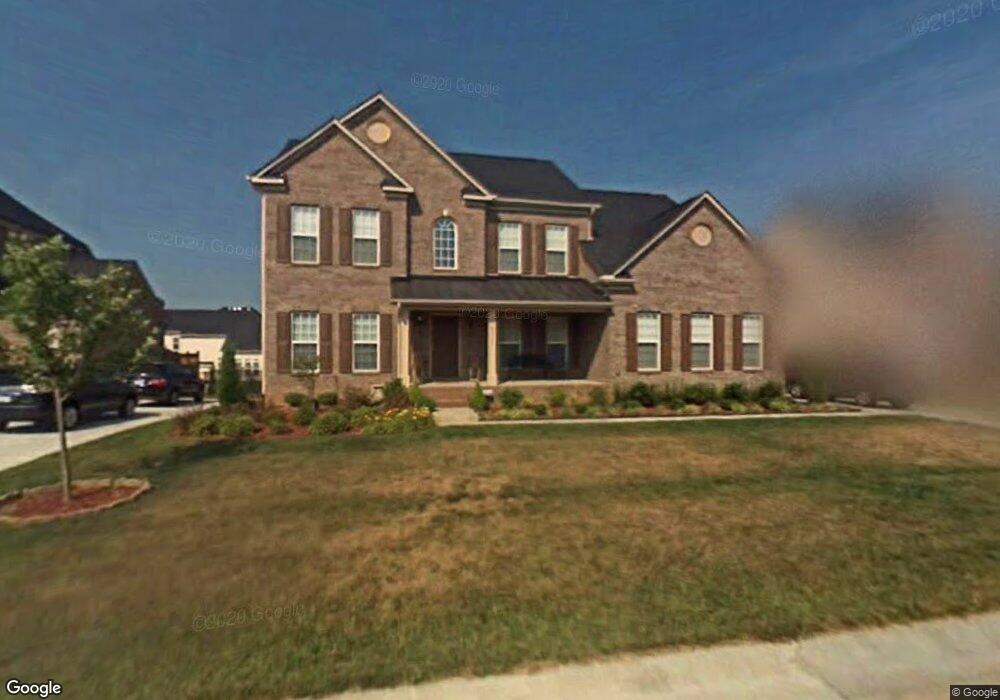
9715 Moss Plantation Ave NW Concord, NC 28027
Estimated Value: $664,000 - $813,000
4
Beds
3
Baths
3,721
Sq Ft
$191/Sq Ft
Est. Value
About This Home
This home is located at 9715 Moss Plantation Ave NW, Concord, NC 28027 and is currently estimated at $709,180, approximately $190 per square foot. 9715 Moss Plantation Ave NW is a home located in Cabarrus County with nearby schools including W.R. Odell Elementary School, Harris Road Middle, and Cox Mill High School.
Ownership History
Date
Name
Owned For
Owner Type
Purchase Details
Closed on
Nov 30, 2010
Sold by
Foster Tony A and Foster Jovon
Bought by
Foster Tony A and Foster Jovon
Current Estimated Value
Purchase Details
Closed on
Dec 27, 2006
Sold by
Nvr Inc
Bought by
Foster Tony A and Foster Jovon
Home Financials for this Owner
Home Financials are based on the most recent Mortgage that was taken out on this home.
Original Mortgage
$80,657
Outstanding Balance
$33,195
Interest Rate
6.19%
Mortgage Type
Credit Line Revolving
Estimated Equity
$675,985
Purchase Details
Closed on
Aug 29, 2006
Sold by
J & B Development & Management Inc
Bought by
Nvr Inc
Purchase Details
Closed on
Aug 28, 2006
Sold by
R J Moss Properties Llc
Bought by
J & B Development & Management Inc
Create a Home Valuation Report for This Property
The Home Valuation Report is an in-depth analysis detailing your home's value as well as a comparison with similar homes in the area
Home Values in the Area
Average Home Value in this Area
Purchase History
| Date | Buyer | Sale Price | Title Company |
|---|---|---|---|
| Foster Tony A | -- | None Available | |
| Foster Tony A | $403,500 | None Available | |
| Nvr Inc | $138,000 | None Available | |
| J & B Development & Management Inc | $8,000 | None Available |
Source: Public Records
Mortgage History
| Date | Status | Borrower | Loan Amount |
|---|---|---|---|
| Open | Foster Tony A | $80,657 | |
| Open | Foster Tony A | $322,628 |
Source: Public Records
Tax History Compared to Growth
Tax History
| Year | Tax Paid | Tax Assessment Tax Assessment Total Assessment is a certain percentage of the fair market value that is determined by local assessors to be the total taxable value of land and additions on the property. | Land | Improvement |
|---|---|---|---|---|
| 2025 | $6,179 | $665,420 | $105,000 | $560,420 |
| 2024 | $6,179 | $665,420 | $105,000 | $560,420 |
| 2023 | $4,711 | $431,120 | $68,000 | $363,120 |
| 2022 | $4,542 | $417,290 | $68,000 | $349,290 |
| 2021 | $4,542 | $417,290 | $68,000 | $349,290 |
| 2020 | $5,091 | $417,290 | $68,000 | $349,290 |
| 2019 | $4,539 | $372,070 | $47,000 | $325,070 |
| 2018 | $4,465 | $372,070 | $47,000 | $325,070 |
| 2017 | $4,260 | $361,010 | $47,000 | $314,010 |
| 2016 | $2,527 | $350,720 | $50,000 | $300,720 |
| 2015 | $4,139 | $350,720 | $50,000 | $300,720 |
| 2014 | $4,139 | $350,720 | $50,000 | $300,720 |
Source: Public Records
Map
Nearby Homes
- 9691 Moss Plantation Ave NW
- 1576 Bay Meadows Ave NW
- 1595 Bay Meadows Ave NW
- 9608 Indian Beech Ave NW
- 9562 Indian Beech Ave NW Unit 291
- 9593 Valencia Ave NW
- 1484 Haverford Rd NW
- 1559 Broderick St NW
- 1423 Napa St NW
- 2274 Laurens Dr
- 2275 Laurens Dr
- 9611 Marquette St NW
- 1418 Skidaway St NW Unit 427
- 1325 Grantwood Ave NW
- 1498 Burrell Ave NW
- 9639 Estridge Ln
- 9711 Marquette St NW
- 10837 Dry Stone Dr
- 9639 Lockwood Rd
- 9768 Walkers Glen Dr NW
- 9719 Moss Plantation Ave NW
- 9711 Moss Plantation Ave NW
- 1510 Tranquility Ave NW
- 1505 Bay Meadows Ave NW
- 9716 Capella Ave NW
- 9720 Capella Ave NW
- 9712 Capella Ave NW
- 1520 Tranquility Ave NW
- 1520 Tranquility Ave NW Unit 1112
- 9723 Moss Plantation Ave NW
- 1511 Bay Meadows Ave NW
- 1511 Tranquility Ave NW
- 9724 Capella Ave NW
- 1530 Tranquility Ave NW
- 1521 Bay Meadows Ave NW
- 9709 Moss Plantation Ave NW
- 9727 Moss Plantation Ave NW
- 1504 Bay Meadows Ave NW
- 1540 Tranquility Ave NW
- 9807 Ravenscroft Ln NW