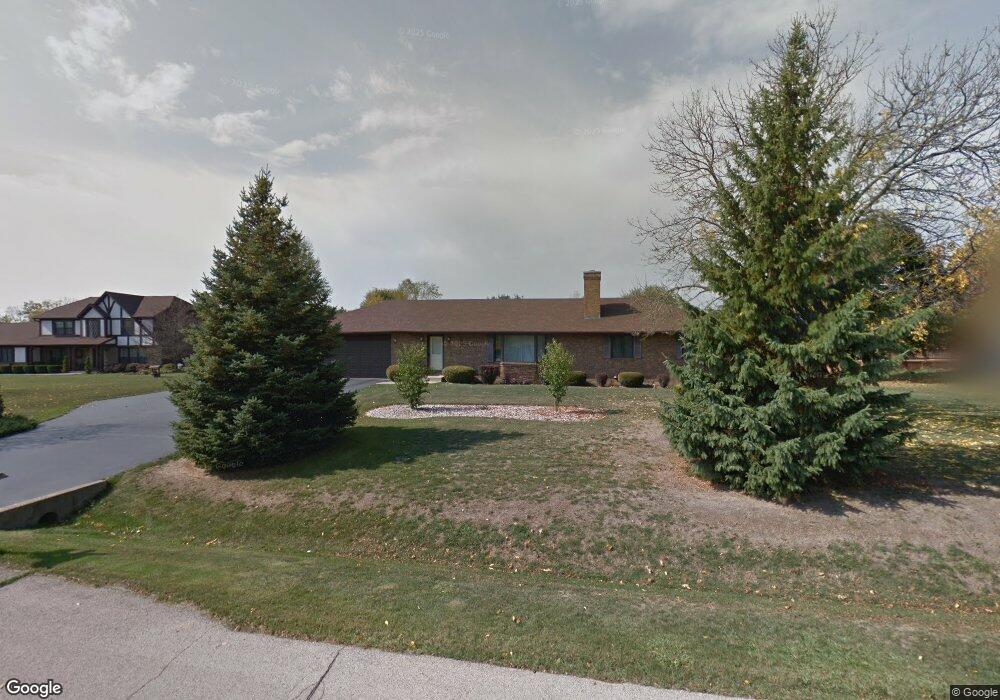
9715 N Hunters Ln Spring Grove, IL 60081
Estimated Value: $347,000 - $437,000
--
Bed
--
Bath
1,845
Sq Ft
$216/Sq Ft
Est. Value
About This Home
This home is located at 9715 N Hunters Ln, Spring Grove, IL 60081 and is currently estimated at $397,942, approximately $215 per square foot. 9715 N Hunters Ln is a home located in McHenry County with nearby schools including Richmond Grade School, Nippersink Middle School, and Richmond-Burton High School.
Ownership History
Date
Name
Owned For
Owner Type
Purchase Details
Closed on
Oct 2, 2004
Sold by
Hungtington Gale L and Huntington Mary Ann
Bought by
Huntington Gale L and Huntington Mary Ann
Current Estimated Value
Purchase Details
Closed on
Jan 20, 2000
Sold by
Culotta John and Culotta Jennifer
Bought by
Huntington Gale L and Huntington Mary Ann
Home Financials for this Owner
Home Financials are based on the most recent Mortgage that was taken out on this home.
Original Mortgage
$177,600
Outstanding Balance
$56,555
Interest Rate
7.87%
Mortgage Type
Purchase Money Mortgage
Estimated Equity
$341,387
Purchase Details
Closed on
Oct 20, 1994
Sold by
Culotta John
Bought by
Culotta John and Culotta Jennifer
Purchase Details
Closed on
Aug 24, 1993
Sold by
Zupan Paul A and Zupan Josephine
Bought by
Culotta John
Home Financials for this Owner
Home Financials are based on the most recent Mortgage that was taken out on this home.
Original Mortgage
$150,000
Interest Rate
7.28%
Mortgage Type
Purchase Money Mortgage
Create a Home Valuation Report for This Property
The Home Valuation Report is an in-depth analysis detailing your home's value as well as a comparison with similar homes in the area
Home Values in the Area
Average Home Value in this Area
Purchase History
| Date | Buyer | Sale Price | Title Company |
|---|---|---|---|
| Huntington Gale L | -- | -- | |
| Huntington Gale L | $222,000 | Chicago Title Insurance Co | |
| Culotta John | -- | -- | |
| Culotta John | -- | -- |
Source: Public Records
Mortgage History
| Date | Status | Borrower | Loan Amount |
|---|---|---|---|
| Open | Huntington Gale L | $177,600 | |
| Previous Owner | Culotta John | $150,000 |
Source: Public Records
Tax History Compared to Growth
Tax History
| Year | Tax Paid | Tax Assessment Tax Assessment Total Assessment is a certain percentage of the fair market value that is determined by local assessors to be the total taxable value of land and additions on the property. | Land | Improvement |
|---|---|---|---|---|
| 2024 | $7,078 | $110,234 | $21,072 | $89,162 |
| 2023 | $6,977 | $102,811 | $19,653 | $83,158 |
| 2022 | $6,764 | $90,439 | $17,288 | $73,151 |
| 2021 | $6,396 | $85,255 | $16,297 | $68,958 |
| 2020 | $6,228 | $81,498 | $15,579 | $65,919 |
| 2019 | $6,258 | $80,231 | $15,337 | $64,894 |
| 2018 | $6,366 | $77,751 | $14,863 | $62,888 |
| 2017 | $6,238 | $73,012 | $13,957 | $59,055 |
| 2016 | $6,231 | $69,728 | $13,329 | $56,399 |
| 2013 | -- | $73,369 | $13,860 | $59,509 |
Source: Public Records
Map
Nearby Homes
- 1914 Spring Dale Dr
- 10201 Fox Bluff Ln
- 9436 Bellaire Ln
- 2303 Fox Bluff Ln
- 8789 Bentley Ln
- 11013 Serenity Path
- 11101 Serenity Path
- 11111 Huron Dr
- 8720 Galleria Ct
- 8610 Steeple Ln
- 8501 Country Shire Ln
- 2214 Main Street Rd
- 8207 Squirrel Dr
- 8303 Appaloosa Ln
- Lot 65 & 66 Main Street Rd
- 8300 Appaloosa Ln
- 7822 N Pillow Hill Rd
- 7830 N Pillow Hill Rd
- Lot 61 Beverly Way
- Lot 57 Beverly Way
- 9719 N Hunters Ln
- 9709 N Hunters Ln
- 9716 N Hunters Ln
- 9710 N Hunters Ln
- 9803 N Hunters Ln
- 9703 N Hunters Ln
- 9714 Dale Ct
- 9704 N Hunters Ln
- 9802 Spring Dale Dr
- 9804 N Hunters Ln
- 9808 Spring Dale Dr
- 9809 N Hunters Ln
- 9708 Dale Ct
- 9617 Richardson Rd
- 9814 Spring Dale Dr
- 9711 Richardson Rd
- 9810 N Hunters Ln
- 9628 N Hunters Ln
- 9719 Richardson Rd
- 1716 W Hunters Ln