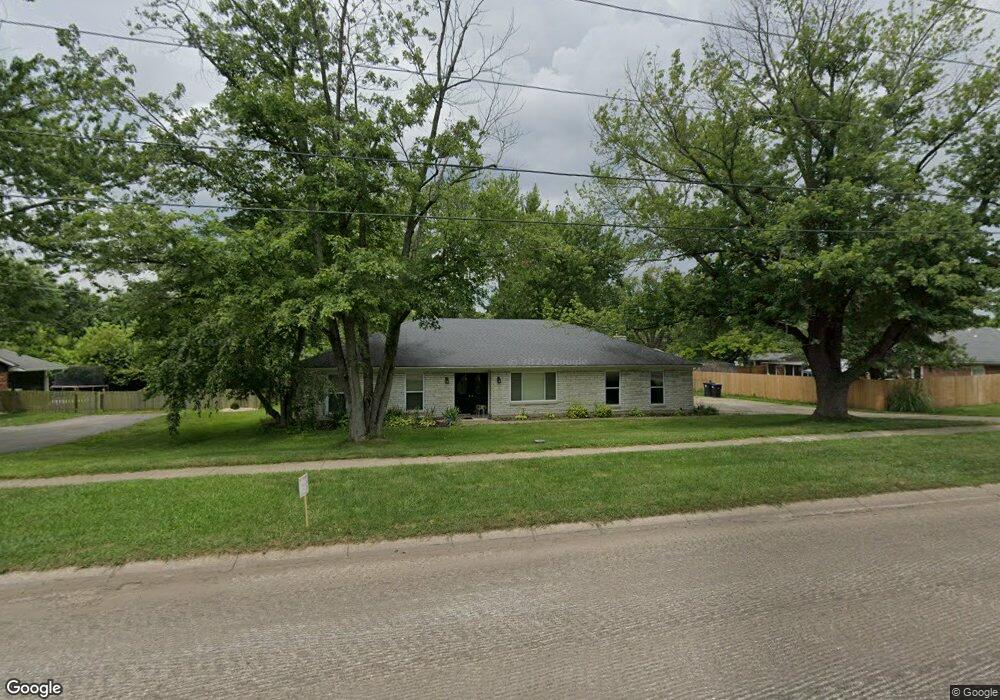
9715 Sheehan Rd Dayton, OH 45458
Estimated Value: $327,000 - $355,000
3
Beds
2
Baths
2,203
Sq Ft
$153/Sq Ft
Est. Value
About This Home
This home is located at 9715 Sheehan Rd, Dayton, OH 45458 and is currently estimated at $336,642, approximately $152 per square foot. 9715 Sheehan Rd is a home located in Montgomery County with nearby schools including Primary Village South, Weller Elementary School, and Magsig Middle School.
Ownership History
Date
Name
Owned For
Owner Type
Purchase Details
Closed on
Dec 29, 2020
Sold by
Osborne Ronnie
Bought by
White Jessica and White Jessica E
Current Estimated Value
Home Financials for this Owner
Home Financials are based on the most recent Mortgage that was taken out on this home.
Original Mortgage
$178,500
Interest Rate
2.65%
Mortgage Type
New Conventional
Purchase Details
Closed on
Jun 29, 2017
Sold by
Sowards Jason S and Sowards Julie A
Bought by
Osborne Ronnie and White Jessica
Home Financials for this Owner
Home Financials are based on the most recent Mortgage that was taken out on this home.
Original Mortgage
$186,558
Interest Rate
4.4%
Mortgage Type
FHA
Purchase Details
Closed on
May 13, 2005
Sold by
Brown Gilbert L
Bought by
Sowards Jason S and Sowards Julie A
Purchase Details
Closed on
Aug 29, 1996
Sold by
Brown Gilbert L and Brown Kathleen A
Bought by
Brown Gilbert L
Create a Home Valuation Report for This Property
The Home Valuation Report is an in-depth analysis detailing your home's value as well as a comparison with similar homes in the area
Purchase History
| Date | Buyer | Sale Price | Title Company |
|---|---|---|---|
| White Jessica | -- | Sterling Land Title Agcy Inc | |
| Osborne Ronnie | $190,000 | Fidelity Lawyers Title Agenc | |
| Sowards Jason S | $151,000 | -- | |
| Brown Gilbert L | -- | -- |
Source: Public Records
Mortgage History
| Date | Status | Borrower | Loan Amount |
|---|---|---|---|
| Previous Owner | White Jessica | $178,500 | |
| Previous Owner | Osborne Ronnie | $186,558 |
Source: Public Records
Tax History
| Year | Tax Paid | Tax Assessment Tax Assessment Total Assessment is a certain percentage of the fair market value that is determined by local assessors to be the total taxable value of land and additions on the property. | Land | Improvement |
|---|---|---|---|---|
| 2025 | $5,965 | $93,930 | $18,600 | $75,330 |
| 2024 | $5,454 | $93,930 | $18,600 | $75,330 |
| 2023 | $5,454 | $93,930 | $18,600 | $75,330 |
| 2022 | $5,199 | $71,010 | $14,090 | $56,920 |
| 2021 | $5,213 | $71,010 | $14,090 | $56,920 |
| 2020 | $5,209 | $71,010 | $14,090 | $56,920 |
| 2019 | $5,152 | $62,720 | $12,250 | $50,470 |
| 2018 | $4,567 | $62,720 | $12,250 | $50,470 |
| 2017 | $4,514 | $62,720 | $12,250 | $50,470 |
| 2016 | $4,051 | $53,100 | $12,250 | $40,850 |
| 2015 | $4,010 | $53,100 | $12,250 | $40,850 |
| 2014 | $4,010 | $53,100 | $12,250 | $40,850 |
| 2012 | -- | $51,720 | $12,250 | $39,470 |
Source: Public Records
Map
Nearby Homes
- 9735 Sheehan Rd
- 370 Lighthouse Trail
- 9920 Sheehan Rd Unit 23
- 318 Joy Elizabeth Dr
- 184 Edinburgh Village Dr Unit 13184
- 8870 Orchard Garden Dr
- 0 Yankee St Unit 934084
- 8864 Orchard Garden Dr
- 2044 Amber Wood Ct
- 9363 Rochelle Ln
- 600 Byrd Ct
- 154 Queens Crossing Unit 31152
- 244 Queens Crossing Unit 23119
- 244 Queens Crossing Unit 119
- 9119 Remy
- 9106 Remy Ct
- 669 Carrick Dr
- 9061 Sorrento Place
- 9061 Sorrento Place Unit 18
- 9045 Sorrento Place Unit 22
- 9725 Sheehan Rd
- 9615 S Normandy Ln
- 9712 Stagecoach Dr S
- 9605 S Normandy Ln
- 9701 Ariadne Trail
- 9732 Stagecoach Dr S
- 9622 S Normandy Ln
- 9745 Sheehan Rd
- 9715 Stagecoach Dr S
- 9602 S Normandy Ln
- 9700 Ariadne Trail
- 9725 Stagecoach Dr S
- 9522 S Normandy Ln
- 9555 Sheehan Rd
- 9720 Sheehan Rd
- 9525 S Normandy Ln
- 9512 Attwood Ct
- 9706 Ariadne Trail
- 9755 Sheehan Rd
- 9735 Stagecoach Dr S