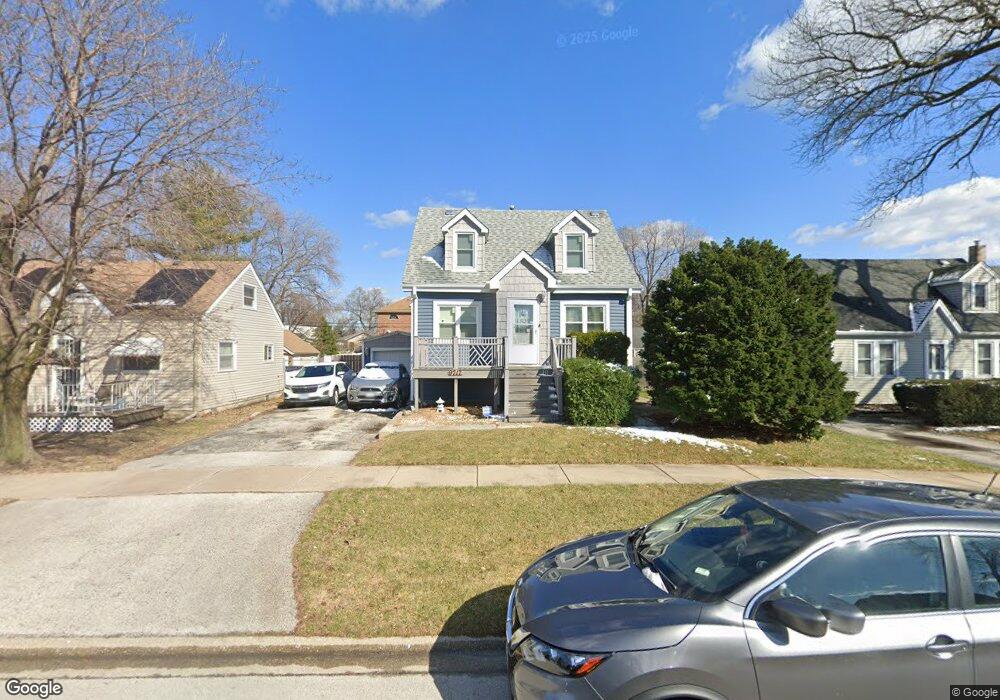
9717 Merrimac Ave Oak Lawn, IL 60453
Estimated Value: $246,000 - $264,331
3
Beds
2
Baths
1,488
Sq Ft
$171/Sq Ft
Est. Value
About This Home
This home is located at 9717 Merrimac Ave, Oak Lawn, IL 60453 and is currently estimated at $254,833, approximately $171 per square foot. 9717 Merrimac Ave is a home located in Cook County with nearby schools including Columbus Manor Elementary School, Simmons Middle School, and Oak Lawn Community High School.
Ownership History
Date
Name
Owned For
Owner Type
Purchase Details
Closed on
Jun 2, 2014
Sold by
Pajak Darren F and Plesniak Cheri A
Bought by
Ramsay Edward and Ramsay Mina
Current Estimated Value
Home Financials for this Owner
Home Financials are based on the most recent Mortgage that was taken out on this home.
Original Mortgage
$145,000
Outstanding Balance
$111,522
Interest Rate
4.5%
Mortgage Type
New Conventional
Estimated Equity
$143,311
Purchase Details
Closed on
Apr 2, 2012
Sold by
Secretary Of Housing & Urban Development
Bought by
Wsh Llc
Purchase Details
Closed on
Aug 24, 2011
Sold by
Diaz
Bought by
Secretary Of Housing & Urban Development
Purchase Details
Closed on
May 4, 2004
Sold by
Gomez Gustavo A and Gomez Debra A
Bought by
Diaz Alejandro and Diaz Gabriela
Purchase Details
Closed on
May 17, 2002
Sold by
Notter Mark A
Bought by
Federal Home Loan Mortgage Corporation
Create a Home Valuation Report for This Property
The Home Valuation Report is an in-depth analysis detailing your home's value as well as a comparison with similar homes in the area
Home Values in the Area
Average Home Value in this Area
Purchase History
| Date | Buyer | Sale Price | Title Company |
|---|---|---|---|
| Ramsay Edward | $165,000 | Millennium Title Group Ltd | |
| Wsh Llc | -- | Ct | |
| Secretary Of Housing & Urban Development | -- | None Available | |
| Diaz Alejandro | $190,000 | Cti | |
| Federal Home Loan Mortgage Corporation | -- | -- |
Source: Public Records
Mortgage History
| Date | Status | Borrower | Loan Amount |
|---|---|---|---|
| Open | Ramsay Edward | $145,000 |
Source: Public Records
Tax History Compared to Growth
Tax History
| Year | Tax Paid | Tax Assessment Tax Assessment Total Assessment is a certain percentage of the fair market value that is determined by local assessors to be the total taxable value of land and additions on the property. | Land | Improvement |
|---|---|---|---|---|
| 2024 | $1,988 | $8,500 | $2,625 | $5,875 |
| 2023 | $2,182 | $8,500 | $2,625 | $5,875 |
| 2022 | $2,182 | $7,924 | $2,250 | $5,674 |
| 2021 | $2,130 | $7,924 | $2,250 | $5,674 |
| 2020 | $2,125 | $7,924 | $2,250 | $5,674 |
| 2019 | $2,060 | $8,060 | $2,062 | $5,998 |
| 2018 | $1,973 | $8,060 | $2,062 | $5,998 |
| 2017 | $2,011 | $8,060 | $2,062 | $5,998 |
| 2016 | $1,870 | $6,819 | $1,687 | $5,132 |
| 2015 | $2,272 | $6,819 | $1,687 | $5,132 |
| 2014 | $1,828 | $6,819 | $1,687 | $5,132 |
| 2013 | $1,684 | $6,915 | $1,687 | $5,228 |
Source: Public Records
Map
Nearby Homes
- 9729 Merton Ave
- 6120 W 98th St
- 9827 Melvina Ave
- 9611 Merton Ave
- 9725 Ridgeland Ave Unit 1N
- 9607 Marion Ave
- 9714 Mcvicker Ave
- 10005 Moody Ave
- 9609 S Austin Ave Unit 1E
- 9912 Austin Ave
- 10030 Moody Ave
- 6237 W 94th St Unit 3S
- 9540 S Mayfield Ave Unit 103S
- 10440 S Mayfield Ave Unit 1A
- 9520 S Mayfield Ave Unit N105
- 5810 W 97th St
- 9725 Normandy Ave
- 9805 Normandy Ave
- 9808 Normandy Ave
- 9935 Menard Ave
- 9717 Merrimac Ave
- 9723 Merrimac Ave
- 9723 Merrimac Ave
- 9715 Merrimac Ave
- 9725 Merrimac Ave
- 9711 Merrimac Ave
- 9711 Merrimac Ave
- 9731 Merrimac Ave
- 9720 Melvina Ave
- 9716 Melvina Ave
- 9724 Melvina Ave
- 9737 Merrimac Ave
- 9710 Melvina Ave
- 9710 Melvina Ave
- 9728 Melvina Ave
- 9722 Merrimac Ave
- 9718 Merrimac Ave
- 9705 Merrimac Ave
- 9724 Merrimac Ave
- 9724 Merrimac Ave