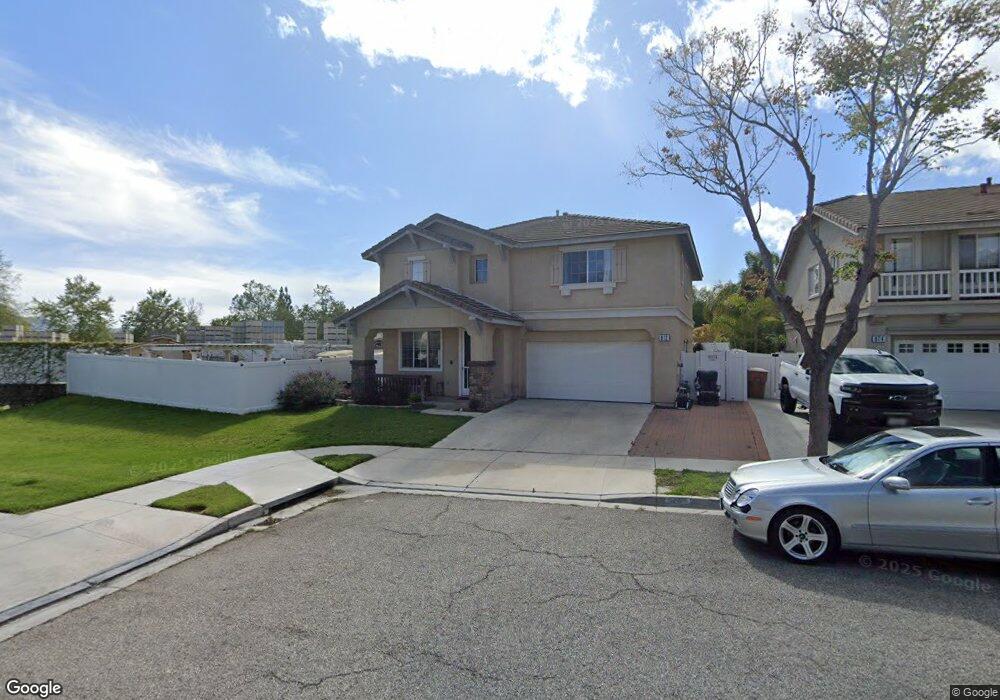
972 Arrasmith Ln Fillmore, CA 93015
Estimated Value: $746,204 - $820,000
3
Beds
3
Baths
2,114
Sq Ft
$369/Sq Ft
Est. Value
About This Home
This home is located at 972 Arrasmith Ln, Fillmore, CA 93015 and is currently estimated at $779,551, approximately $368 per square foot. 972 Arrasmith Ln is a home located in Ventura County with nearby schools including Mountain Vista and Fillmore Senior High.
Ownership History
Date
Name
Owned For
Owner Type
Purchase Details
Closed on
Oct 4, 2000
Sold by
The Griffin Homebuilding Group Llc
Bought by
Allen Gale
Current Estimated Value
Home Financials for this Owner
Home Financials are based on the most recent Mortgage that was taken out on this home.
Original Mortgage
$189,950
Interest Rate
7.82%
Create a Home Valuation Report for This Property
The Home Valuation Report is an in-depth analysis detailing your home's value as well as a comparison with similar homes in the area
Home Values in the Area
Average Home Value in this Area
Purchase History
We collect this data history from publicly available records. To have your information removed, we recommend requesting removal directly through your county’s website.
| Date | Buyer | Sale Price | Title Company |
|---|---|---|---|
| Allen Gale | $237,500 | First American Title Ins Co |
Source: Public Records
Mortgage History
We collect this data history from publicly available records. To have your information removed, we recommend requesting removal directly through your county’s website.
| Date | Status | Borrower | Loan Amount |
|---|---|---|---|
| Previous Owner | Allen Gale | $189,950 | |
| Closed | Allen Gale | $23,700 |
Source: Public Records
Tax History
| Year | Tax Paid | Tax Assessment Tax Assessment Total Assessment is a certain percentage of the fair market value that is determined by local assessors to be the total taxable value of land and additions on the property. | Land | Improvement |
|---|---|---|---|---|
| 2025 | $5,056 | $357,824 | $143,128 | $214,696 |
| 2024 | $5,056 | $350,808 | $140,321 | $210,487 |
| 2023 | $4,998 | $343,930 | $137,570 | $206,360 |
| 2022 | $4,670 | $337,187 | $134,873 | $202,314 |
| 2021 | $5,102 | $330,576 | $132,228 | $198,348 |
| 2020 | $4,808 | $327,188 | $130,873 | $196,315 |
| 2019 | $4,783 | $320,773 | $128,307 | $192,466 |
| 2018 | $4,682 | $314,485 | $125,792 | $188,693 |
| 2017 | $4,675 | $308,320 | $123,326 | $184,994 |
| 2016 | $4,374 | $302,275 | $120,908 | $181,367 |
| 2015 | $4,266 | $297,737 | $119,093 | $178,644 |
| 2014 | $4,241 | $291,907 | $116,761 | $175,146 |
Source: Public Records
Map
Nearby Homes
- 922 Hinckley Ln
- 1129 1st St
- 1112 Mockingbird Ln
- 1143 Los Serenos Dr
- 1012 Ortega St
- 815 Woodgrove Rd
- 809 Woodgrove Rd
- 320 D St
- 222 Village Square
- 553 Grapefruit Ln
- 202 Avon Ln
- 553 Sespe Ave
- 135 Surrey Way
- 1401 Waterford Ln
- 989 Santa fe St
- 300 Fillmore St
- 1000 Foothill Dr
- 340 Central Ave
- 639 Mountain View St
- 503 Arundell Cir
- 974 Arrasmith Ln
- 978 Arrasmith Ln
- 976 Arrasmith Ln
- 971 Arrasmith Ln
- 975 Arrasmith Ln
- 979 Arrasmith Ln
- 980 Arrasmith Ln
- 981 Arrasmith Ln
- 967 3rd St
- 985 Arrasmith Ln
- 986 Arrasmith Ln
- 982 Arrasmith Ln
- 965 3rd St
- 984 Arrasmith Ln
- 966 Blaine Ave
- 987 Arrasmith Ln
- 961 3rd St
- 996 Arrasmith Ln
- 998 Arrasmith Ln
- 989 Arrasmith Ln
Your Personal Tour Guide
Ask me questions while you tour the home.