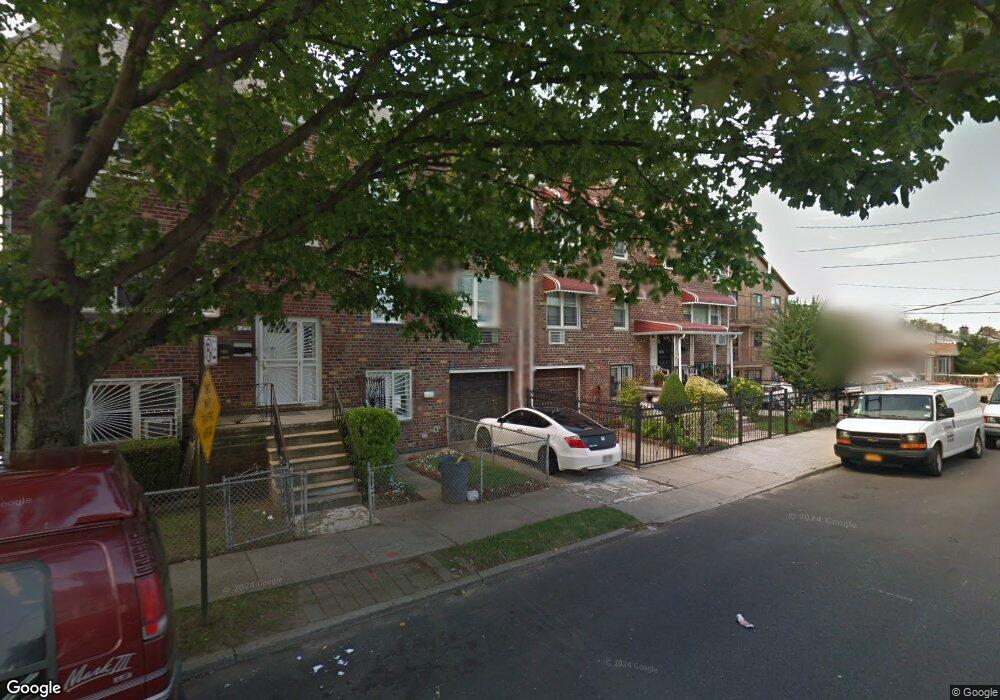
972 E 88th St Unit 204 Brooklyn, NY 11236
Canarsie NeighborhoodEstimated Value: $295,000 - $478,000
Studio
--
Bath
872
Sq Ft
$450/Sq Ft
Est. Value
About This Home
This home is located at 972 E 88th St Unit 204, Brooklyn, NY 11236 and is currently estimated at $392,119, approximately $449 per square foot. 972 E 88th St Unit 204 is a home located in Kings County with nearby schools including P.S. 114 Ryder Elementary School, Is 68 Isaac Bildersee, and Explore Excel Charter School.
Ownership History
Date
Name
Owned For
Owner Type
Purchase Details
Closed on
Nov 15, 2005
Sold by
David Dozier Michael and Dozier Cromer Mary
Bought by
Sterling Ann M
Current Estimated Value
Home Financials for this Owner
Home Financials are based on the most recent Mortgage that was taken out on this home.
Original Mortgage
$184,000
Outstanding Balance
$97,161
Interest Rate
6.14%
Mortgage Type
Purchase Money Mortgage
Estimated Equity
$294,958
Purchase Details
Closed on
Nov 10, 1998
Sold by
Berkeley Federal Bank & Trust Fsb and Ocwen Federal Bank Fsb
Bought by
Dozier Harold
Home Financials for this Owner
Home Financials are based on the most recent Mortgage that was taken out on this home.
Original Mortgage
$80,750
Interest Rate
6.78%
Mortgage Type
Purchase Money Mortgage
Purchase Details
Closed on
Aug 20, 1997
Sold by
Citibank Na and Ocwen Federal Bank Fsb
Bought by
Ocwen Federal Bank Fsb
Purchase Details
Closed on
Jun 6, 1997
Sold by
Clark Julia A
Bought by
Citibank Na
Create a Home Valuation Report for This Property
The Home Valuation Report is an in-depth analysis detailing your home's value as well as a comparison with similar homes in the area
Home Values in the Area
Average Home Value in this Area
Purchase History
We collect this data history from publicly available records. To have your information removed, we recommend requesting removal directly through your county’s website.
| Date | Buyer | Sale Price | Title Company |
|---|---|---|---|
| Sterling Ann M | $230,000 | -- | |
| Dozier Harold | $85,000 | -- | |
| Ocwen Federal Bank Fsb | $92,500 | -- | |
| Citibank Na | $143,000 | -- |
Source: Public Records
Mortgage History
We collect this data history from publicly available records. To have your information removed, we recommend requesting removal directly through your county’s website.
| Date | Status | Borrower | Loan Amount |
|---|---|---|---|
| Open | Sterling Ann M | $184,000 | |
| Previous Owner | Dozier Harold | $80,750 |
Source: Public Records
Tax History
| Year | Tax Paid | Tax Assessment Tax Assessment Total Assessment is a certain percentage of the fair market value that is determined by local assessors to be the total taxable value of land and additions on the property. | Land | Improvement |
|---|---|---|---|---|
| 2026 | $3,214 | $34,827 | $2,183 | $32,644 |
| 2025 | $3,020 | $30,453 | $2,183 | $28,270 |
| 2024 | $3,020 | $26,103 | $2,183 | $23,920 |
| 2023 | $3,053 | $23,071 | $2,183 | $20,888 |
| 2022 | $2,969 | $21,270 | $2,183 | $19,087 |
| 2021 | $2,943 | $18,508 | $2,183 | $16,325 |
| 2020 | $1,371 | $13,696 | $2,183 | $11,513 |
| 2019 | $2,572 | $13,696 | $2,183 | $11,513 |
| 2018 | $2,669 | $14,555 | $1,972 | $12,583 |
| 2017 | $2,500 | $13,732 | $2,008 | $11,724 |
| 2016 | $2,280 | $12,956 | $1,679 | $11,277 |
| 2015 | $1,343 | $12,580 | $1,414 | $11,166 |
| 2014 | $1,343 | $12,580 | $1,633 | $10,947 |
Source: Public Records
Map
Nearby Homes
- 972 E 88th St Unit 1
- 971 E 87th St Unit 6
- 8617 Avenue J
- 956 E 87th St
- 8702 Avenue J
- 937 E 89th St
- 1026 E 86th St
- 923 E 85th St
- 8418 Avenue J
- 760 E 86th St
- 921 E 84th St
- 1243 E 91st St
- 1043 E 84th St
- 1028 E 84th St
- 8317 Flatlands Ave
- 8222 Avenue J
- 930 E 83rd St
- 1190 E 93rd St
- 1147 E 92nd St
- 1161 E 88th St
- 971 E 87 St Unit 5
- 971 E 87 St Unit 206
- 971 E 87 St Unit 6
- 972 E 88th St Unit 203
- 972 E 88th St Unit 202
- 972 E 88th St Unit 201
- 972 E 88th St Unit 106
- 972 E 88th St Unit 105
- 972 E 88th St Unit 104
- 972 E 88th St Unit 103
- 972 E 88th St Unit 102
- 972 E 88th St Unit 101
- 972 E 88th St Unit 7
- 972 E 88th St Unit 4
- 972 E 88th St Unit 3
- 972 E 88th St Unit 2
- 972 E 88th St
- 956 E 88th St
- 963 E 87th St
- 971 E 87th St Unit 207
Your Personal Tour Guide
Ask me questions while you tour the home.