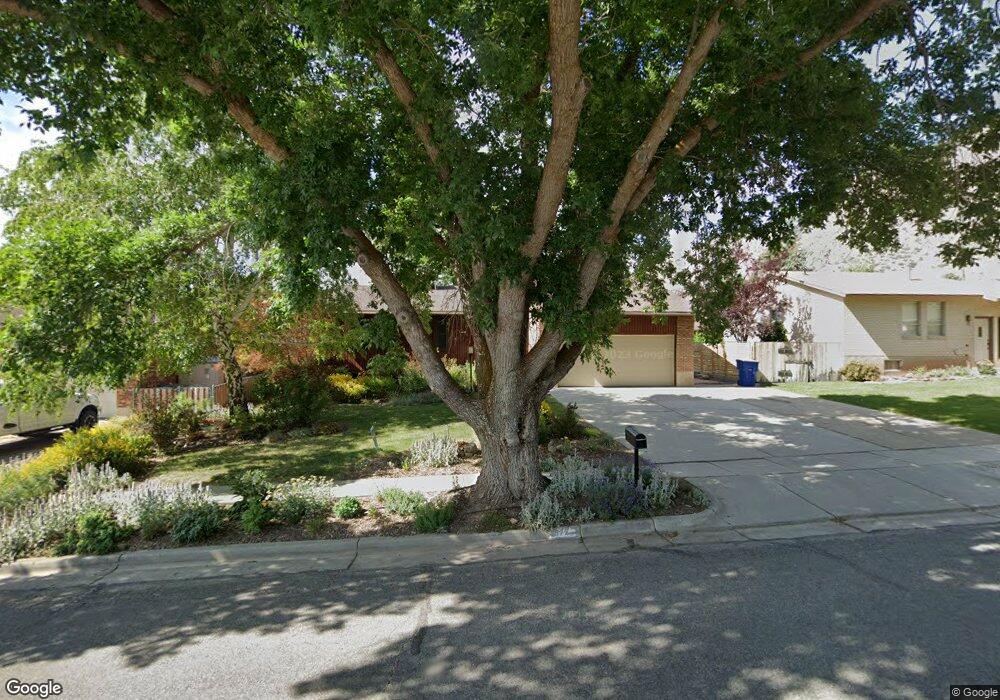
972 Hudson St Ogden, UT 84404
Hillcrest-Bonneville NeighborhoodEstimated Value: $369,000 - $455,854
5
Beds
3
Baths
2,295
Sq Ft
$182/Sq Ft
Est. Value
About This Home
This home is located at 972 Hudson St, Ogden, UT 84404 and is currently estimated at $417,464, approximately $181 per square foot. 972 Hudson St is a home located in Weber County with nearby schools including Highland Junior High School and Ben Lomond High School.
Ownership History
Date
Name
Owned For
Owner Type
Purchase Details
Closed on
Nov 19, 2025
Sold by
Cottle Garrett Trust
Bought by
Four Peaks Trust and Garrett
Current Estimated Value
Purchase Details
Closed on
Jun 20, 2017
Sold by
Garrett Jill Cottie
Bought by
Cottle Garrett Trust
Purchase Details
Closed on
Aug 16, 2013
Sold by
Huntington Darrell and Huntington Jennifer
Bought by
Garrett Jill Cottle
Purchase Details
Closed on
Dec 10, 2004
Sold by
Haight Hunter G and Haight Teresa I
Bought by
Donery Robert and Donery Renee
Home Financials for this Owner
Home Financials are based on the most recent Mortgage that was taken out on this home.
Original Mortgage
$102,400
Interest Rate
6.5%
Mortgage Type
New Conventional
Purchase Details
Closed on
Nov 15, 1996
Sold by
Haight Hunter G
Bought by
Haight Hunter G and Haight Teresa I
Purchase Details
Closed on
Feb 15, 1996
Sold by
Cook Sheila
Bought by
Haight Hunter G
Home Financials for this Owner
Home Financials are based on the most recent Mortgage that was taken out on this home.
Original Mortgage
$112,145
Interest Rate
6.99%
Mortgage Type
FHA
Create a Home Valuation Report for This Property
The Home Valuation Report is an in-depth analysis detailing your home's value as well as a comparison with similar homes in the area
Home Values in the Area
Average Home Value in this Area
Purchase History
| Date | Buyer | Sale Price | Title Company |
|---|---|---|---|
| Four Peaks Trust | -- | None Listed On Document | |
| Cottle Garrett Trust | -- | None Available | |
| Garrett Jill Cottle | -- | First American | |
| Donery Robert | -- | First American Title | |
| Haight Hunter G | -- | Bonneville Title | |
| Haight Hunter G | -- | Bonneville Title |
Source: Public Records
Mortgage History
| Date | Status | Borrower | Loan Amount |
|---|---|---|---|
| Previous Owner | Donery Robert | $102,400 | |
| Previous Owner | Haight Hunter G | $112,145 | |
| Closed | Donery Robert | $25,600 |
Source: Public Records
Tax History
| Year | Tax Paid | Tax Assessment Tax Assessment Total Assessment is a certain percentage of the fair market value that is determined by local assessors to be the total taxable value of land and additions on the property. | Land | Improvement |
|---|---|---|---|---|
| 2025 | $3,388 | $460,490 | $120,000 | $340,490 |
| 2024 | $3,333 | $246,948 | $66,012 | $180,936 |
| 2023 | $2,990 | $222,750 | $63,106 | $159,644 |
| 2022 | $3,180 | $239,800 | $49,504 | $190,296 |
| 2021 | $2,739 | $340,000 | $60,026 | $279,974 |
| 2020 | $2,424 | $276,001 | $46,978 | $229,023 |
| 2019 | $2,414 | $258,000 | $39,816 | $218,184 |
| 2018 | $2,120 | $223,001 | $30,919 | $192,082 |
| 2017 | $1,834 | $178,000 | $30,919 | $147,081 |
| 2016 | $1,879 | $99,076 | $16,531 | $82,545 |
| 2015 | $1,517 | $77,269 | $16,531 | $60,738 |
| 2014 | $1,494 | $74,915 | $15,445 | $59,470 |
Source: Public Records
Map
Nearby Homes
- 580 Marco Ln
- 1062 Hudson St
- 357 Monroe Blvd Unit 5
- 1090 Harrop St
- 1243 Hudson St
- 630 S Plum Creek Ln E
- 322 Harrison Blvd
- 1274 5th St
- 142 S Eccles Ave
- 758 3rd St
- 756 3rd St
- 3091 N 3075 W
- 1010 1st St
- 718 9th St
- 876 E 1025 S Unit 49
- 621 7th St
- 423 E 1025 S
- 419 E 1025 S
- 983 Rancho Blvd Unit 3
- 1363 Lewis Dr
Your Personal Tour Guide
Ask me questions while you tour the home.