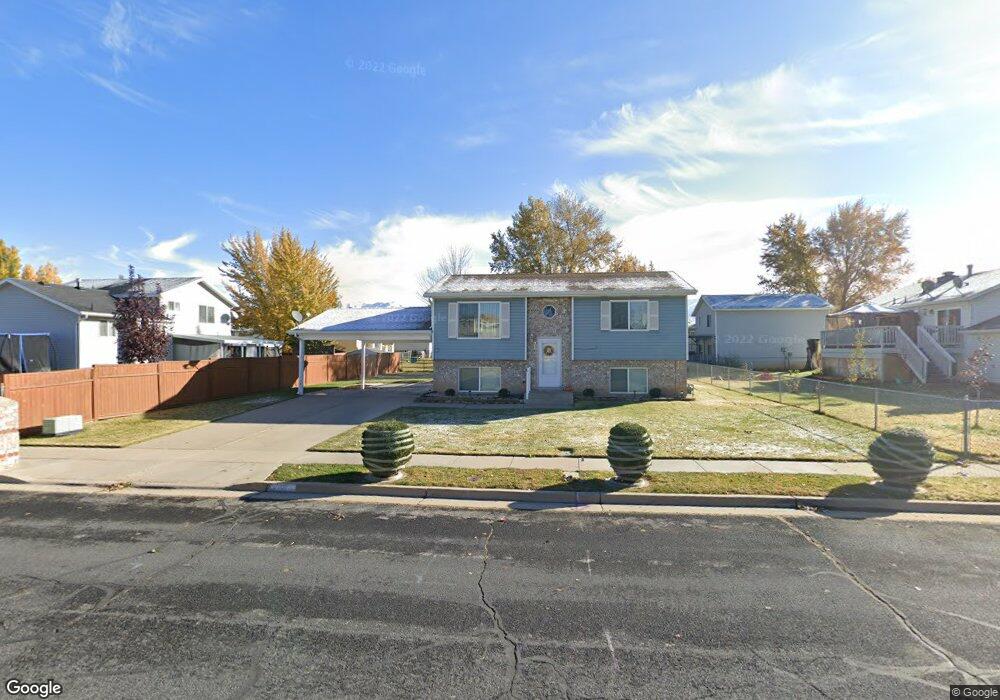
972 N 700 W Clearfield, UT 84015
Estimated Value: $367,685 - $413,000
3
Beds
1
Bath
861
Sq Ft
$446/Sq Ft
Est. Value
About This Home
This home is located at 972 N 700 W, Clearfield, UT 84015 and is currently estimated at $384,171, approximately $446 per square foot. 972 N 700 W is a home with nearby schools including Clinton Elementary School, Sunset Junior High School, and Clearfield High School.
Ownership History
Date
Name
Owned For
Owner Type
Purchase Details
Closed on
Jan 3, 2021
Sold by
Duran Anita A and Reed Anita A
Bought by
Reed Monty G and Reed Anita A
Current Estimated Value
Purchase Details
Closed on
Jul 6, 2004
Sold by
Noriega Michael M and Noriega Anita A
Bought by
Duran Anita
Home Financials for this Owner
Home Financials are based on the most recent Mortgage that was taken out on this home.
Original Mortgage
$66,355
Interest Rate
5.61%
Mortgage Type
Purchase Money Mortgage
Create a Home Valuation Report for This Property
The Home Valuation Report is an in-depth analysis detailing your home's value as well as a comparison with similar homes in the area
Home Values in the Area
Average Home Value in this Area
Purchase History
| Date | Buyer | Sale Price | Title Company |
|---|---|---|---|
| Reed Monty G | -- | Accommodation | |
| Duran Anita | -- | First American Title Co |
Source: Public Records
Mortgage History
| Date | Status | Borrower | Loan Amount |
|---|---|---|---|
| Closed | Duran Anita | $66,355 |
Source: Public Records
Tax History Compared to Growth
Tax History
| Year | Tax Paid | Tax Assessment Tax Assessment Total Assessment is a certain percentage of the fair market value that is determined by local assessors to be the total taxable value of land and additions on the property. | Land | Improvement |
|---|---|---|---|---|
| 2025 | $1,888 | $181,501 | $83,254 | $98,247 |
| 2024 | $1,821 | $175,999 | $92,217 | $83,782 |
| 2023 | $1,633 | $160,600 | $57,028 | $103,571 |
| 2022 | $1,718 | $309,000 | $118,081 | $190,919 |
| 2021 | $1,615 | $237,000 | $78,745 | $158,255 |
| 2020 | $1,398 | $203,000 | $65,591 | $137,409 |
| 2019 | $1,388 | $197,000 | $79,110 | $117,890 |
| 2018 | $1,255 | $175,000 | $67,146 | $107,854 |
| 2016 | $1,110 | $79,915 | $25,865 | $54,050 |
| 2015 | $1,031 | $70,565 | $25,865 | $44,700 |
| 2014 | $1,031 | $71,671 | $25,865 | $45,806 |
| 2013 | -- | $69,133 | $27,143 | $41,990 |
Source: Public Records
Map
Nearby Homes