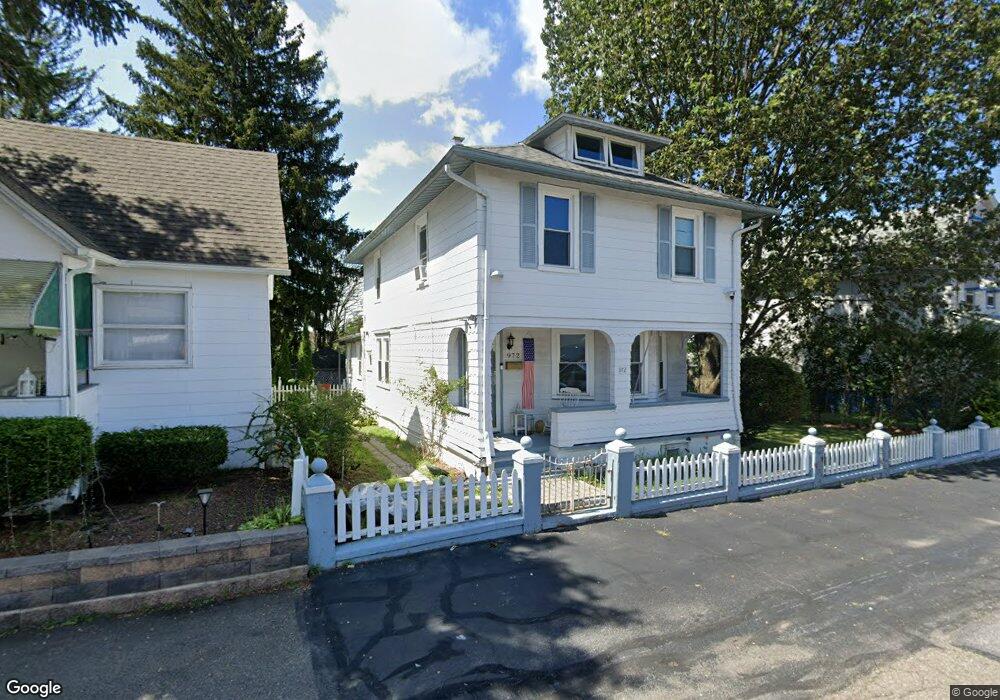
972 N James St Hazleton, PA 18201
Estimated Value: $219,000 - $249,000
3
Beds
1
Bath
1,603
Sq Ft
$146/Sq Ft
Est. Value
About This Home
This home is located at 972 N James St, Hazleton, PA 18201 and is currently estimated at $234,143, approximately $146 per square foot. 972 N James St is a home located in Luzerne County with nearby schools including Hazleton Area High School, Immanuel Christian School, and Bishop Hafey Junior/Senior High School.
Ownership History
Date
Name
Owned For
Owner Type
Purchase Details
Closed on
Jun 8, 2023
Sold by
Fox Jason T
Bought by
Cruz Ruben D
Current Estimated Value
Home Financials for this Owner
Home Financials are based on the most recent Mortgage that was taken out on this home.
Original Mortgage
$183,658
Outstanding Balance
$178,783
Interest Rate
6.43%
Mortgage Type
FHA
Estimated Equity
$55,360
Purchase Details
Closed on
May 4, 2004
Bought by
Fox Jason T
Create a Home Valuation Report for This Property
The Home Valuation Report is an in-depth analysis detailing your home's value as well as a comparison with similar homes in the area
Home Values in the Area
Average Home Value in this Area
Purchase History
| Date | Buyer | Sale Price | Title Company |
|---|---|---|---|
| Cruz Ruben D | $190,000 | None Listed On Document | |
| Fox Jason T | $84,900 | -- |
Source: Public Records
Mortgage History
| Date | Status | Borrower | Loan Amount |
|---|---|---|---|
| Open | Cruz Ruben D | $183,658 |
Source: Public Records
Tax History Compared to Growth
Tax History
| Year | Tax Paid | Tax Assessment Tax Assessment Total Assessment is a certain percentage of the fair market value that is determined by local assessors to be the total taxable value of land and additions on the property. | Land | Improvement |
|---|---|---|---|---|
| 2025 | $3,358 | $116,900 | $29,500 | $87,400 |
| 2024 | $3,146 | $116,900 | $29,500 | $87,400 |
| 2023 | $2,941 | $116,900 | $29,500 | $87,400 |
| 2022 | $2,920 | $116,900 | $29,500 | $87,400 |
| 2021 | $2,852 | $116,900 | $29,500 | $87,400 |
| 2020 | $2,548 | $116,900 | $29,500 | $87,400 |
| 2019 | $2,629 | $116,900 | $29,500 | $87,400 |
| 2018 | $2,540 | $116,900 | $29,500 | $87,400 |
| 2017 | $2,341 | $116,900 | $29,500 | $87,400 |
| 2016 | $1,279 | $116,900 | $29,500 | $87,400 |
| 2015 | $1,248 | $116,900 | $29,500 | $87,400 |
| 2014 | $1,248 | $116,900 | $29,500 | $87,400 |
Source: Public Records
Map
Nearby Homes
- 1009 Peace St
- 882 N Locust St
- 782 N James St
- 756 Peace St
- 827 N Vine St
- 714 Alter St
- 837 N Laurel St
- 739 N Church St
- 19 W 14th St
- 738 N Manhattan Ct
- 667 Roosevelt St
- 60 E Jefferson Ave
- 609 Landmesser Ave
- 991 Seybert St
- 572 N Vine St
- 590 Mckinley St
- 1087 N Rear Locust St
- 522 N James St
- 756 Seybert St
- 731 W 1st St