Estimated Value: $1,234,000 - $1,589,000
6
Beds
4
Baths
5,724
Sq Ft
$250/Sq Ft
Est. Value
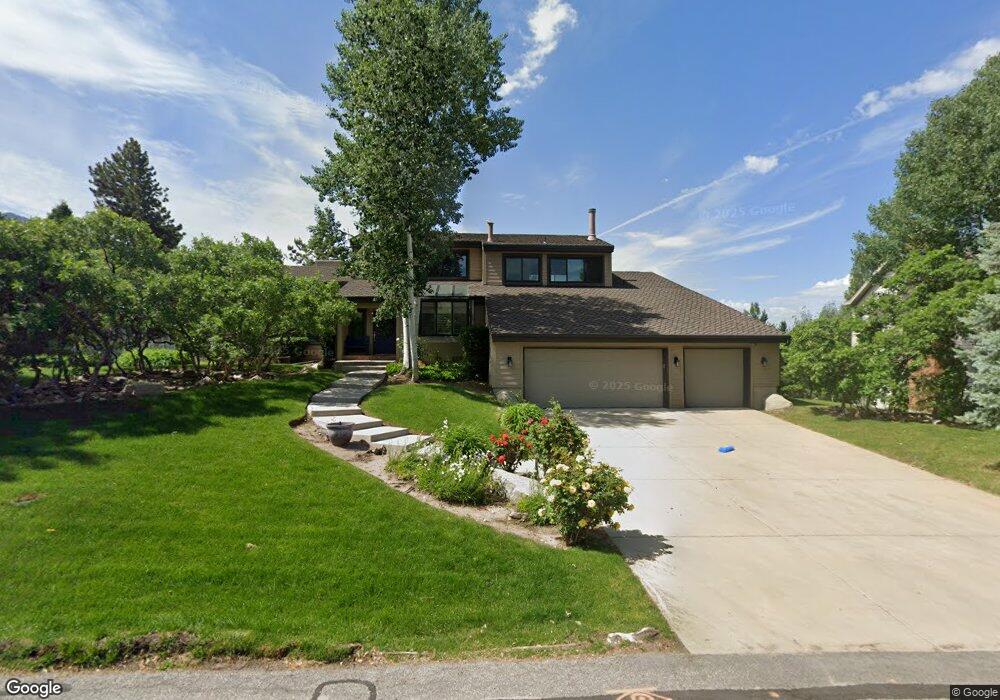
About This Home
This home is located at 9720 Ruskin Cir, Sandy, UT 84092 and is currently estimated at $1,432,889, approximately $250 per square foot. 9720 Ruskin Cir is a home located in Salt Lake County with nearby schools including Granite Elementary School, Albion Middle School, and Brighton High School.
Ownership History
Date
Name
Owned For
Owner Type
Purchase Details
Closed on
Jun 28, 2002
Sold by
Reynolds Trey and Reynolds Andrea K
Bought by
Gritton Bonnie and Gritton Stephen M
Current Estimated Value
Home Financials for this Owner
Home Financials are based on the most recent Mortgage that was taken out on this home.
Original Mortgage
$125,000
Outstanding Balance
$53,553
Interest Rate
6.86%
Mortgage Type
Seller Take Back
Estimated Equity
$1,379,336
Purchase Details
Closed on
Aug 14, 1997
Sold by
Reynolds Leonard L and Reynolds Cheri S
Bought by
Reynolds Trey and Reynolds Andrea K
Home Financials for this Owner
Home Financials are based on the most recent Mortgage that was taken out on this home.
Original Mortgage
$288,000
Interest Rate
7.61%
Purchase Details
Closed on
Apr 22, 1995
Sold by
Reynolds Leonard L and Reynolds Cheri S
Bought by
Reynolds Leonard L and Reynolds Cheri S
Create a Home Valuation Report for This Property
The Home Valuation Report is an in-depth analysis detailing your home's value as well as a comparison with similar homes in the area
Home Values in the Area
Average Home Value in this Area
Purchase History
| Date | Buyer | Sale Price | Title Company |
|---|---|---|---|
| Gritton Bonnie | -- | Superior Title Company | |
| Reynolds Trey | -- | Surety Title Agency | |
| Reynolds Leonard L | -- | -- |
Source: Public Records
Mortgage History
| Date | Status | Borrower | Loan Amount |
|---|---|---|---|
| Open | Gritton Bonnie | $125,000 | |
| Previous Owner | Reynolds Trey | $288,000 |
Source: Public Records
Tax History Compared to Growth
Tax History
| Year | Tax Paid | Tax Assessment Tax Assessment Total Assessment is a certain percentage of the fair market value that is determined by local assessors to be the total taxable value of land and additions on the property. | Land | Improvement |
|---|---|---|---|---|
| 2025 | $6,032 | $1,210,700 | $444,200 | $766,500 |
| 2024 | $6,032 | $1,143,100 | $417,200 | $725,900 |
| 2023 | $5,653 | $1,070,200 | $401,100 | $669,100 |
| 2022 | $6,001 | $1,122,800 | $393,300 | $729,500 |
| 2021 | $5,545 | $880,000 | $354,600 | $525,400 |
| 2020 | $4,918 | $737,000 | $354,600 | $382,400 |
| 2019 | $4,881 | $713,800 | $354,600 | $359,200 |
| 2018 | $4,106 | $628,800 | $302,100 | $326,700 |
| 2017 | $4,188 | $613,900 | $254,100 | $359,800 |
| 2016 | $3,678 | $521,600 | $244,800 | $276,800 |
| 2015 | $4,367 | $574,000 | $230,800 | $343,200 |
| 2014 | $4,003 | $517,100 | $214,500 | $302,600 |
Source: Public Records
Map
Nearby Homes
- 3240 Granite Point Cir
- 3149 E 10000 S
- 3357 Glacier Ln
- 10142 S Majestic Canyon Rd
- 9623 Tannenbaum Cove
- 9673 Chylene Dr
- 9577 S Hidden Pine Ln
- 10175 S Dimple Dell Rd
- 9512 S Granite Trail Ln E Unit 393
- 9472 S Granite Trail Ln E Unit 391
- 10234 Dimple Dell Ln Unit 8
- 10279 S Dimple Dell Rd E Unit 103
- 10280 S Dimple Dell Rd
- 10432 S Wasatch Blvd
- 10471 S Wasatch Blvd
- 10471 S Wasatch Blvd Unit 27
- 10480 S Seven Springs Cir Unit 23
- 9942 S Altamont Dr
- 2495 E Granite Hills Cir
- 3409 Seven Springs Dr
- 9710 Ruskin Cir
- 9710 S Ruskin Cir
- 9728 Ruskin Cir
- 9705 S Ruskin Cir
- 9705 Ruskin Cir
- 3255 E Old Wasatch Blvd S
- 9726 Ruskin Cir
- 9717 Ruskin Cir
- 9706 Ruskin Cir
- 9706 S Ruskin Cir
- 9725 Ruskin Cir
- 3290 E Ruskin Ct
- 3290 Ruskin Ct
- 9692 Ruskin Cir
- 9767 S Jameson Point Cove
- 9767 Jameson Point Cove
- 3210 Granite Woods Ln
- 3207 Granite Woods Ln
- 3296 Ruskin Ct
- 9675 S Ruskin Cir