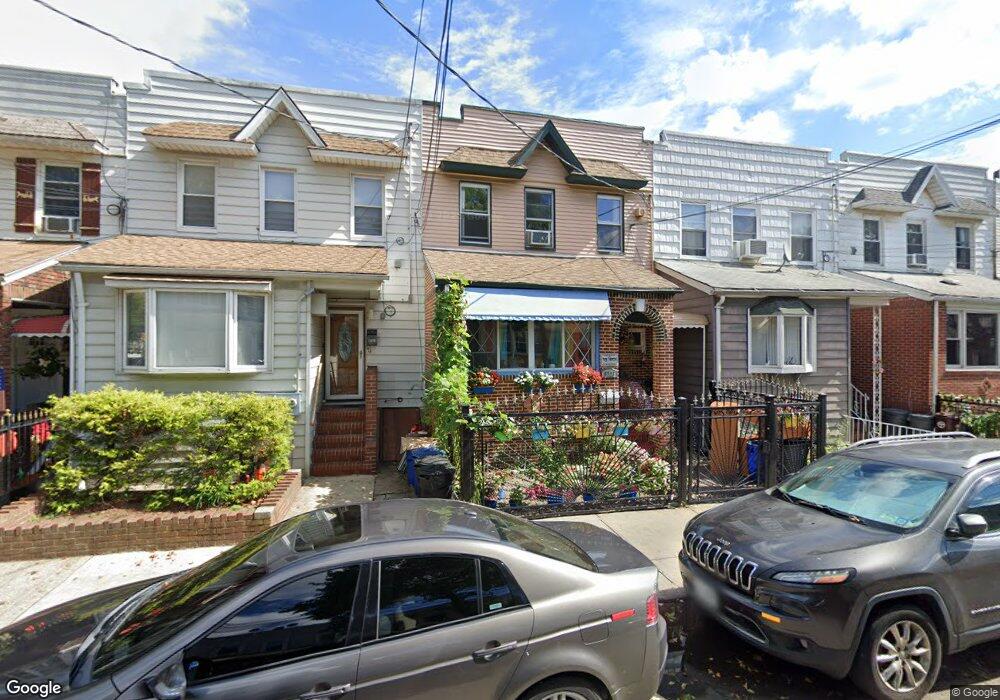
9721 81st St Ozone Park, NY 11416
Ozone Park NeighborhoodEstimated Value: $712,446 - $757,000
--
Bed
--
Bath
1,371
Sq Ft
$538/Sq Ft
Est. Value
About This Home
This home is located at 9721 81st St, Ozone Park, NY 11416 and is currently estimated at $737,112, approximately $537 per square foot. 9721 81st St is a home located in Queens County with nearby schools including P.S. 64 - Joseph P. Addabbo, Santiam Elementary School, and Jhs 210 Elizabeth Blackwell.
Ownership History
Date
Name
Owned For
Owner Type
Purchase Details
Closed on
Apr 7, 2015
Sold by
Leana Ivelisse B and Leana Fernando M
Bought by
Montalvo William
Current Estimated Value
Purchase Details
Closed on
May 7, 2013
Sold by
Navarro Frances and Navarro Phyllis
Bought by
Leana Fernando M and Leana Ivelisse B
Home Financials for this Owner
Home Financials are based on the most recent Mortgage that was taken out on this home.
Original Mortgage
$304,000
Interest Rate
3.45%
Mortgage Type
New Conventional
Create a Home Valuation Report for This Property
The Home Valuation Report is an in-depth analysis detailing your home's value as well as a comparison with similar homes in the area
Home Values in the Area
Average Home Value in this Area
Purchase History
| Date | Buyer | Sale Price | Title Company |
|---|---|---|---|
| Montalvo William | $410,000 | -- | |
| Leana Fernando M | $320,000 | -- |
Source: Public Records
Mortgage History
| Date | Status | Borrower | Loan Amount |
|---|---|---|---|
| Previous Owner | Leana Fernando M | $304,000 |
Source: Public Records
Tax History Compared to Growth
Tax History
| Year | Tax Paid | Tax Assessment Tax Assessment Total Assessment is a certain percentage of the fair market value that is determined by local assessors to be the total taxable value of land and additions on the property. | Land | Improvement |
|---|---|---|---|---|
| 2025 | $6,131 | $32,316 | $8,606 | $23,710 |
| 2024 | $6,131 | $30,524 | $9,166 | $21,358 |
| 2023 | $6,011 | $29,600 | $8,280 | $21,320 |
| 2022 | $5,850 | $40,980 | $12,000 | $28,980 |
| 2021 | $5,873 | $38,820 | $12,000 | $26,820 |
| 2020 | $5,700 | $36,540 | $12,000 | $24,540 |
| 2019 | $5,321 | $35,520 | $12,000 | $23,520 |
| 2018 | $5,028 | $24,667 | $8,794 | $15,873 |
| 2017 | $2,494 | $24,004 | $11,139 | $12,865 |
| 2016 | $4,547 | $24,004 | $11,139 | $12,865 |
| 2015 | $2,512 | $22,442 | $12,645 | $9,797 |
| 2014 | $2,512 | $21,198 | $13,072 | $8,126 |
Source: Public Records
Map
Nearby Homes