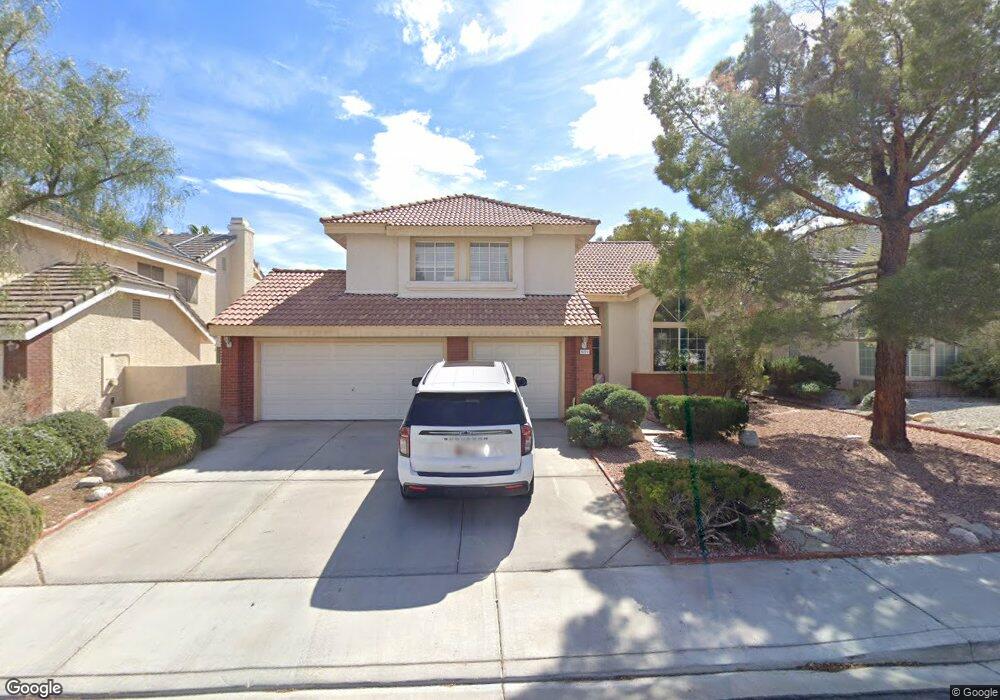
9721 Cascade Falls Ave Las Vegas, NV 89117
The Section Seven NeighborhoodEstimated Value: $558,521 - $657,000
4
Beds
3
Baths
2,232
Sq Ft
$276/Sq Ft
Est. Value
About This Home
This home is located at 9721 Cascade Falls Ave, Las Vegas, NV 89117 and is currently estimated at $616,630, approximately $276 per square foot. 9721 Cascade Falls Ave is a home located in Clark County with nearby schools including M J Christensen Elementary School, Clifford J Lawrence Junior High School, and Bonanza High School.
Ownership History
Date
Name
Owned For
Owner Type
Purchase Details
Closed on
Sep 1, 2022
Sold by
Brand Rhonda R
Bought by
Brand Rhonda R and Brand Prentice
Current Estimated Value
Purchase Details
Closed on
May 26, 2020
Sold by
Brand Rhonda R and Banks Morris L
Bought by
Brand Rhonda R
Purchase Details
Closed on
Sep 25, 1996
Sold by
Banks Morris L and Banks Lois J
Bought by
Banks Morris L and Banks Lois J
Create a Home Valuation Report for This Property
The Home Valuation Report is an in-depth analysis detailing your home's value as well as a comparison with similar homes in the area
Home Values in the Area
Average Home Value in this Area
Purchase History
| Date | Buyer | Sale Price | Title Company |
|---|---|---|---|
| Brand Rhonda R | -- | -- | |
| Brand Rhonda R | -- | None Available | |
| Banks Morris L | -- | -- | |
| Banks Morris L | -- | -- |
Source: Public Records
Tax History Compared to Growth
Tax History
| Year | Tax Paid | Tax Assessment Tax Assessment Total Assessment is a certain percentage of the fair market value that is determined by local assessors to be the total taxable value of land and additions on the property. | Land | Improvement |
|---|---|---|---|---|
| 2025 | $3,225 | $116,136 | $52,150 | $63,986 |
| 2024 | $3,225 | $116,136 | $52,150 | $63,986 |
| 2023 | $3,225 | $108,533 | $46,900 | $61,633 |
| 2022 | $2,986 | $96,334 | $39,550 | $56,784 |
| 2021 | $2,765 | $91,728 | $37,450 | $54,278 |
| 2020 | $2,565 | $88,006 | $33,950 | $54,056 |
| 2019 | $2,404 | $83,742 | $30,100 | $53,642 |
| 2018 | $2,294 | $79,940 | $28,000 | $51,940 |
| 2017 | $2,658 | $81,069 | $28,000 | $53,069 |
| 2016 | $2,147 | $74,064 | $20,650 | $53,414 |
| 2015 | $2,142 | $63,397 | $17,850 | $45,547 |
| 2014 | $2,080 | $63,274 | $12,250 | $51,024 |
Source: Public Records
Map
Nearby Homes
- 9713 Cascade Falls Ave
- 9724 Cascade Falls Ave
- 3001 Bridge Creek St
- 9717 Sierra Mesa Ave
- 9624 Beach Water Cir
- 9605 Blowing Sand Cir
- 9708 Blazing Star Ct
- 9548 Wooden Pier Way
- 2821 Willow Wind Ct
- 2728 Monrovia Dr
- 2729 Beachside Ct
- 9504 Cliff View Way
- 2724 Monrovia Dr
- 9544 Lazy River Dr
- 2909 Ivory Reef Ct
- 3213 Shallow Point Cir
- 9429 Abalone Way
- 9833 Dardanelle Ct
- 3009 Periscope Ct
- 9820 Cross Creek Way
- 9717 Cascade Falls Ave
- 9725 Cascade Falls Ave
- 9720 Terrace Green Ave
- 9724 Terrace Green Ave
- 9716 Terrace Green Ave
- 9729 Cascade Falls Ave
- 9720 Cascade Falls Ave
- 9728 Terrace Green Ave
- 9716 Cascade Falls Ave
- 9712 Terrace Green Ave
- 9728 Cascade Falls Ave
- 2929 Hampton Bluff St
- 2928 Bridge Creek St
- 9721 Terrace Green Ave
- 9717 Terrace Green Ave
- 3000 Hampton Bluff St
- 9725 Terrace Green Ave
- 3004 Hampton Bluff St
- 3005 Bridge Creek St Unit none
- 3005 Bridge Creek St