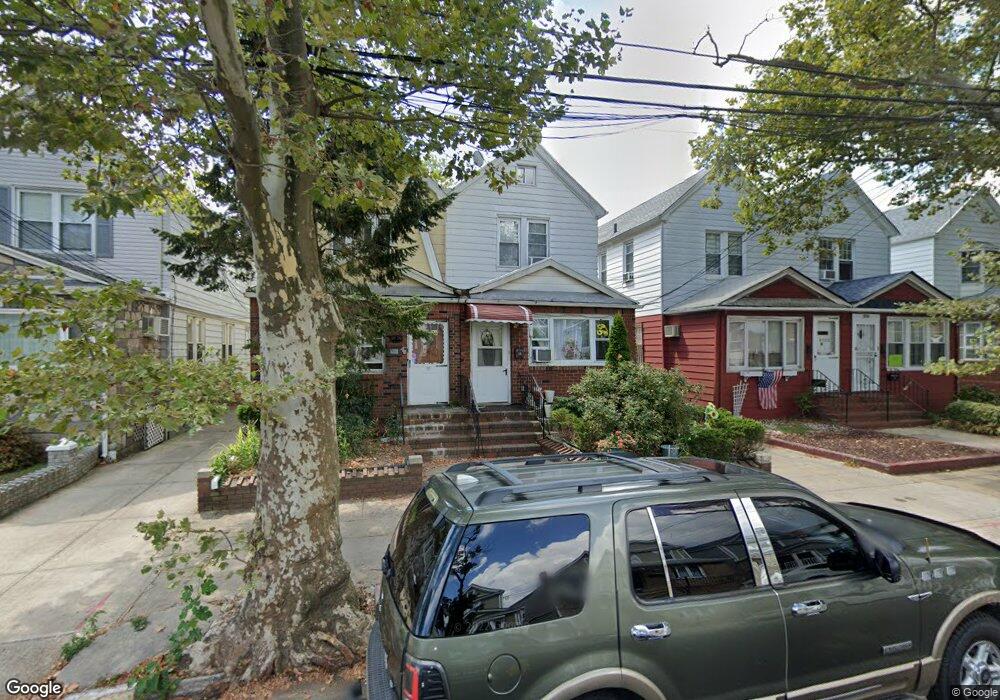
9722 84th St Ozone Park, NY 11416
Ozone Park NeighborhoodEstimated Value: $629,000 - $767,322
--
Bed
--
Bath
1,249
Sq Ft
$569/Sq Ft
Est. Value
About This Home
This home is located at 9722 84th St, Ozone Park, NY 11416 and is currently estimated at $711,081, approximately $569 per square foot. 9722 84th St is a home located in Queens County with nearby schools including P.S. 64 - Joseph P. Addabbo, Santiam Elementary School, and Jhs 210 Elizabeth Blackwell.
Ownership History
Date
Name
Owned For
Owner Type
Purchase Details
Closed on
Oct 8, 2025
Sold by
Atlantic Avenue 86 Llc
Bought by
Akram Uddin Mohammed and Aktar Ruzina
Current Estimated Value
Home Financials for this Owner
Home Financials are based on the most recent Mortgage that was taken out on this home.
Original Mortgage
$632,400
Outstanding Balance
$632,400
Interest Rate
6.35%
Mortgage Type
Purchase Money Mortgage
Estimated Equity
$78,681
Purchase Details
Closed on
Sep 21, 2022
Sold by
Sawicki Joseph and Sawicki Lorraine
Bought by
Atlantic Avenue 86 Llc
Create a Home Valuation Report for This Property
The Home Valuation Report is an in-depth analysis detailing your home's value as well as a comparison with similar homes in the area
Home Values in the Area
Average Home Value in this Area
Purchase History
| Date | Buyer | Sale Price | Title Company |
|---|---|---|---|
| Akram Uddin Mohammed | $744,000 | -- | |
| Atlantic Avenue 86 Llc | $725,000 | -- |
Source: Public Records
Mortgage History
| Date | Status | Borrower | Loan Amount |
|---|---|---|---|
| Open | Akram Uddin Mohammed | $632,400 |
Source: Public Records
Tax History Compared to Growth
Tax History
| Year | Tax Paid | Tax Assessment Tax Assessment Total Assessment is a certain percentage of the fair market value that is determined by local assessors to be the total taxable value of land and additions on the property. | Land | Improvement |
|---|---|---|---|---|
| 2025 | $6,291 | $33,200 | $9,908 | $23,292 |
| 2024 | $6,291 | $31,321 | $8,777 | $22,544 |
| 2023 | $6,001 | $29,549 | $9,169 | $20,380 |
| 2022 | $5,037 | $42,840 | $12,660 | $30,180 |
| 2021 | $5,270 | $36,300 | $12,660 | $23,640 |
| 2020 | $4,951 | $37,980 | $12,660 | $25,320 |
| 2019 | $4,565 | $34,500 | $12,660 | $21,840 |
| 2018 | $4,135 | $24,624 | $10,669 | $13,955 |
| 2017 | $4,405 | $24,624 | $10,370 | $14,254 |
| 2016 | $4,266 | $24,624 | $10,370 | $14,254 |
| 2015 | $2,511 | $23,056 | $13,387 | $9,669 |
| 2014 | $2,511 | $21,751 | $13,682 | $8,069 |
Source: Public Records
Map
Nearby Homes