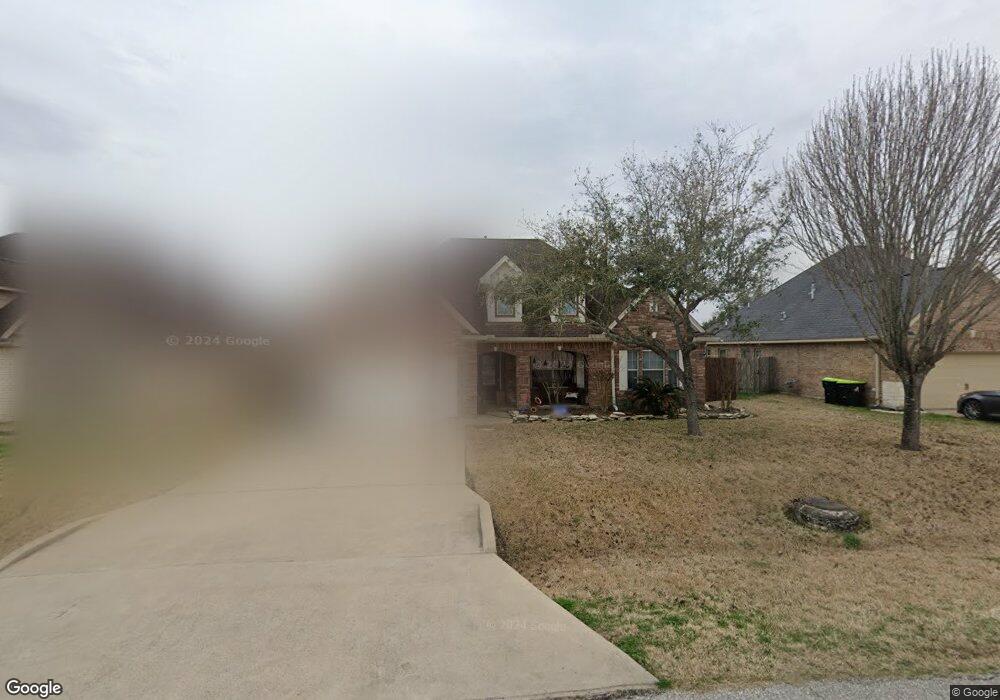
9722 Highland Pointe Dr Needville, TX 77461
Estimated Value: $378,000 - $392,000
4
Beds
2
Baths
2,439
Sq Ft
$158/Sq Ft
Est. Value
About This Home
This home is located at 9722 Highland Pointe Dr, Needville, TX 77461 and is currently estimated at $386,177, approximately $158 per square foot. 9722 Highland Pointe Dr is a home located in Fort Bend County with nearby schools including Needville Elementary School, Needville Junior High School, and Needville Middle School.
Ownership History
Date
Name
Owned For
Owner Type
Purchase Details
Closed on
Aug 12, 2016
Sold by
Simons Dawn Michelle
Bought by
Bruce Brock and Bruce Emily
Current Estimated Value
Home Financials for this Owner
Home Financials are based on the most recent Mortgage that was taken out on this home.
Original Mortgage
$259,218
Outstanding Balance
$206,826
Interest Rate
3.48%
Mortgage Type
FHA
Estimated Equity
$179,351
Purchase Details
Closed on
Sep 4, 2009
Sold by
Gonzalez Joe and Gonzalez Tery Rey
Bought by
Simons Dawn Michelle
Home Financials for this Owner
Home Financials are based on the most recent Mortgage that was taken out on this home.
Original Mortgage
$163,308
Interest Rate
5.2%
Mortgage Type
FHA
Purchase Details
Closed on
Aug 1, 2008
Sold by
The Metropolitan Group Inc
Bought by
Gonzalez Joe
Create a Home Valuation Report for This Property
The Home Valuation Report is an in-depth analysis detailing your home's value as well as a comparison with similar homes in the area
Home Values in the Area
Average Home Value in this Area
Purchase History
| Date | Buyer | Sale Price | Title Company |
|---|---|---|---|
| Bruce Brock | -- | Startex Title Co Llc | |
| Simons Dawn Michelle | -- | Startex Title Company | |
| Bruce Brock | -- | -- | |
| Gonzalez Joe | -- | Ameripoint Title | |
| Bruce Brock | -- | -- |
Source: Public Records
Mortgage History
| Date | Status | Borrower | Loan Amount |
|---|---|---|---|
| Open | Bruce Brock | $259,218 | |
| Previous Owner | Bruce Brock | $163,308 |
Source: Public Records
Tax History Compared to Growth
Tax History
| Year | Tax Paid | Tax Assessment Tax Assessment Total Assessment is a certain percentage of the fair market value that is determined by local assessors to be the total taxable value of land and additions on the property. | Land | Improvement |
|---|---|---|---|---|
| 2025 | $6,883 | $374,512 | $43,810 | $330,702 |
| 2024 | $6,883 | $362,819 | $2,461 | $360,358 |
| 2023 | $6,883 | $329,835 | $0 | $359,150 |
| 2022 | $6,207 | $299,850 | $0 | $304,750 |
| 2021 | $6,145 | $272,590 | $24,200 | $248,390 |
| 2020 | $6,563 | $275,730 | $22,000 | $253,730 |
| 2019 | $7,020 | $273,670 | $22,000 | $251,670 |
| 2018 | $6,603 | $259,760 | $22,000 | $237,760 |
| 2017 | $6,458 | $253,160 | $22,000 | $231,160 |
| 2016 | $6,426 | $251,890 | $22,000 | $229,890 |
| 2015 | $5,874 | $253,390 | $22,000 | $231,390 |
| 2014 | $6,166 | $256,680 | $22,000 | $234,680 |
Source: Public Records
Map
Nearby Homes
- 3819 Willow Breeze
- 3818 Founders Dr
- 3811 Candlewood Cir
- 3803 Doveswood Cir
- 0 Colony Rd
- 3814 Doveswood Cir
- 14210 Cally Cir
- 14624 Dove Ln
- 9206 Kostelnik St
- 3339 Terry St
- 10010 Texas 36
- 3002 Caroline St
- 14234 Hay Meadow Ln
- 14238 Hay Meadow Ln
- 3118 Violet St
- 13911 W Richmond St
- 8912 Park St
- 14218 Golden Wheat Ln
- 8903 Milby St
- 00 Hurta
- 9726 Highland Pointe Dr
- 9718 Highland Pointe Dr
- 9715 Piney Point Cir
- 9714 Highland Pointe Dr
- 9711 Piney Point Cir
- 9719 Piney Point Cir
- 9723 Highland Pointe
- 3803 Willow Breeze Cir
- 9727 Highland Pointe
- 9707 Piney Point
- 9707 Piney Point Cir
- 9719 Highland Pointe Dr
- 9710 Highland Pointe Dr
- 3811 Willow Breeze Cir
- 3815 Willow Breeze Cir
- 9703 Piney Point Cir
- 3807 Willow Breeze Cir
- 3823 Willow Breeze
- 9718 Piney Point Cir
- 9714 Piney Point Cir