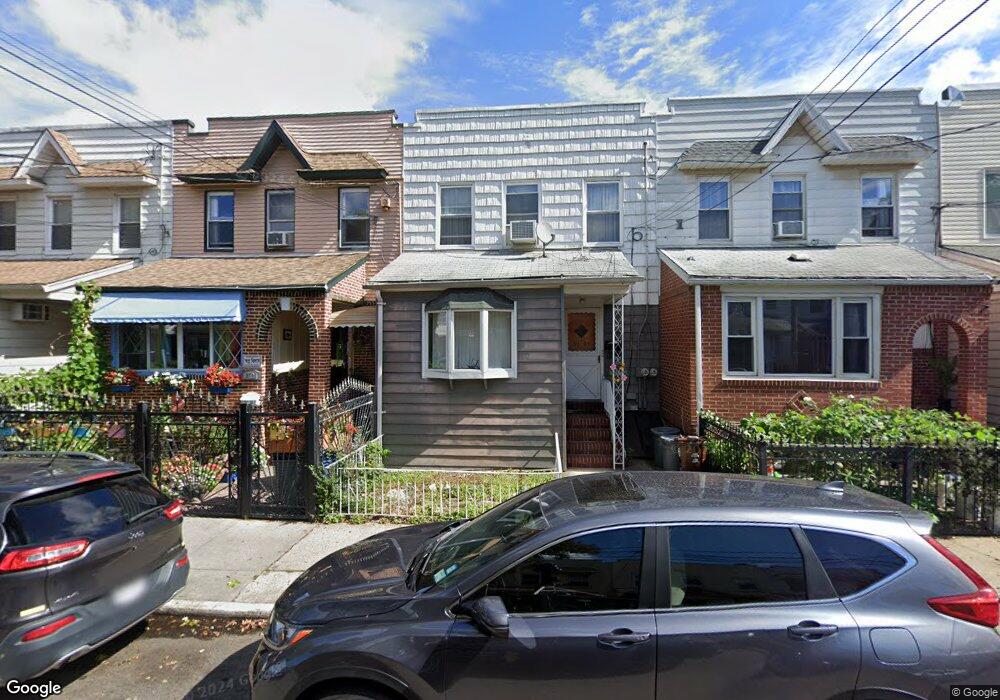
9723 81st St Ozone Park, NY 11416
Ozone Park NeighborhoodEstimated Value: $717,022 - $780,000
--
Bed
--
Bath
1,371
Sq Ft
$549/Sq Ft
Est. Value
About This Home
This home is located at 9723 81st St, Ozone Park, NY 11416 and is currently estimated at $752,006, approximately $548 per square foot. 9723 81st St is a home located in Queens County with nearby schools including P.S. 64 - Joseph P. Addabbo, Santiam Elementary School, and Jhs 210 Elizabeth Blackwell.
Ownership History
Date
Name
Owned For
Owner Type
Purchase Details
Closed on
May 6, 2022
Sold by
Sanchez Milka
Bought by
Aktary Mosammat Rubeia and Sidick Md A
Current Estimated Value
Home Financials for this Owner
Home Financials are based on the most recent Mortgage that was taken out on this home.
Original Mortgage
$548,000
Outstanding Balance
$520,681
Interest Rate
5.27%
Mortgage Type
Purchase Money Mortgage
Estimated Equity
$231,325
Purchase Details
Closed on
Aug 25, 2000
Sold by
Mach Julie L and Mach Hato
Bought by
Sanchez Milka
Home Financials for this Owner
Home Financials are based on the most recent Mortgage that was taken out on this home.
Original Mortgage
$193,800
Interest Rate
7.96%
Create a Home Valuation Report for This Property
The Home Valuation Report is an in-depth analysis detailing your home's value as well as a comparison with similar homes in the area
Home Values in the Area
Average Home Value in this Area
Purchase History
| Date | Buyer | Sale Price | Title Company |
|---|---|---|---|
| Aktary Mosammat Rubeia | $685,000 | -- | |
| Sanchez Milka | $204,000 | Fidelity National Title Ins |
Source: Public Records
Mortgage History
| Date | Status | Borrower | Loan Amount |
|---|---|---|---|
| Open | Aktary Mosammat Rubeia | $548,000 | |
| Previous Owner | Sanchez Milka | $193,800 |
Source: Public Records
Tax History Compared to Growth
Tax History
| Year | Tax Paid | Tax Assessment Tax Assessment Total Assessment is a certain percentage of the fair market value that is determined by local assessors to be the total taxable value of land and additions on the property. | Land | Improvement |
|---|---|---|---|---|
| 2025 | $5,849 | $30,276 | $9,096 | $21,180 |
| 2024 | $5,849 | $29,122 | $9,803 | $19,319 |
| 2023 | $5,518 | $27,475 | $8,100 | $19,375 |
| 2022 | $3,756 | $36,240 | $12,240 | $24,000 |
| 2021 | $5,032 | $38,760 | $12,240 | $26,520 |
| 2020 | $5,044 | $34,620 | $12,240 | $22,380 |
| 2019 | $4,784 | $32,520 | $12,240 | $20,280 |
| 2018 | $4,370 | $22,896 | $10,023 | $12,873 |
| 2017 | $4,206 | $22,104 | $10,660 | $11,444 |
| 2016 | $3,907 | $22,104 | $10,660 | $11,444 |
| 2015 | $2,295 | $21,025 | $13,221 | $7,804 |
| 2014 | $2,295 | $20,224 | $13,117 | $7,107 |
Source: Public Records
Map
Nearby Homes