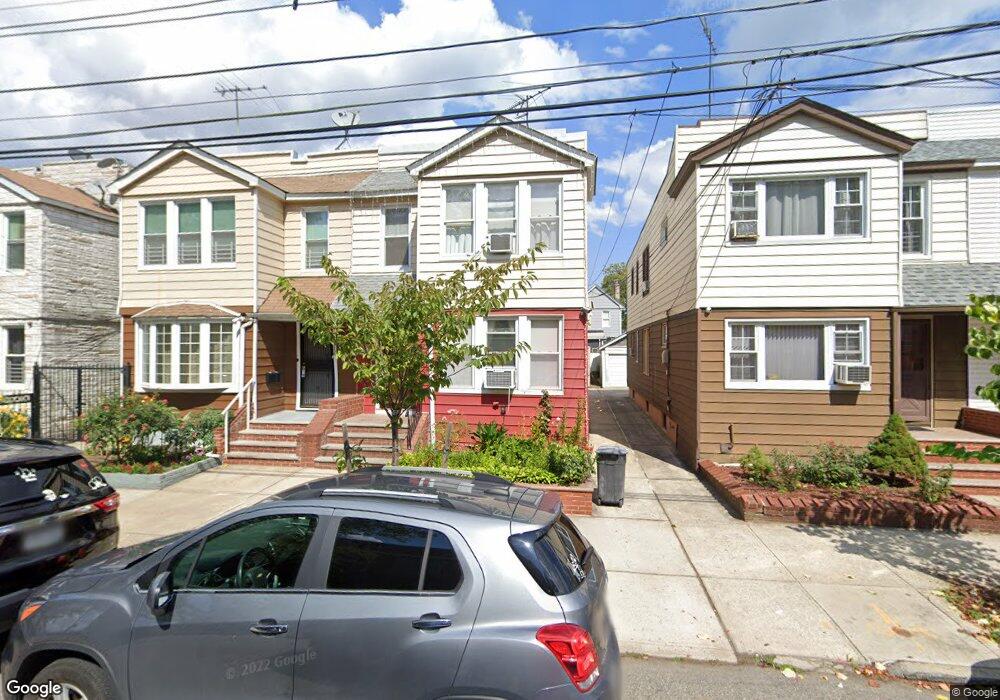
9723 83rd St Unit 2nd FL Ozone Park, NY 11416
Ozone Park NeighborhoodEstimated Value: $809,735 - $1,169,000
3
Beds
1
Bath
1,000
Sq Ft
$986/Sq Ft
Est. Value
About This Home
This home is located at 9723 83rd St Unit 2nd FL, Ozone Park, NY 11416 and is currently estimated at $985,934, approximately $985 per square foot. 9723 83rd St Unit 2nd FL is a home located in Queens County with nearby schools including P.S. 64 - Joseph P. Addabbo, Santiam Elementary School, and Jhs 210 Elizabeth Blackwell.
Ownership History
Date
Name
Owned For
Owner Type
Purchase Details
Closed on
Feb 23, 2024
Sold by
Liu Liyan and Yang Xiaoxin
Bought by
Yang Alan and Yang Xiaoxin
Current Estimated Value
Purchase Details
Closed on
Nov 30, 2017
Sold by
Montesdeoca Jose
Bought by
Liu Liyan and Yang Xiaoxin
Home Financials for this Owner
Home Financials are based on the most recent Mortgage that was taken out on this home.
Original Mortgage
$415,000
Outstanding Balance
$347,751
Interest Rate
3.94%
Mortgage Type
New Conventional
Estimated Equity
$638,183
Purchase Details
Closed on
Oct 8, 2004
Sold by
Harrington Adriana and Harrington H
Bought by
Montesdeoca Jose
Home Financials for this Owner
Home Financials are based on the most recent Mortgage that was taken out on this home.
Original Mortgage
$68,850
Interest Rate
5.85%
Create a Home Valuation Report for This Property
The Home Valuation Report is an in-depth analysis detailing your home's value as well as a comparison with similar homes in the area
Home Values in the Area
Average Home Value in this Area
Purchase History
| Date | Buyer | Sale Price | Title Company |
|---|---|---|---|
| Yang Alan | -- | -- | |
| Yang Alan | -- | -- | |
| Yang Alan | -- | -- | |
| Liu Liyan | $808,000 | -- | |
| Liu Liyan | $808,000 | -- | |
| Montesdeoca Jose | $460,000 | -- | |
| Montesdeoca Jose | $460,000 | -- |
Source: Public Records
Mortgage History
| Date | Status | Borrower | Loan Amount |
|---|---|---|---|
| Open | Liu Liyan | $415,000 | |
| Closed | Liu Liyan | $415,000 | |
| Previous Owner | Montesdeoca Jose | $68,850 | |
| Previous Owner | Montesdeoca Jose | $367,200 |
Source: Public Records
Tax History Compared to Growth
Tax History
| Year | Tax Paid | Tax Assessment Tax Assessment Total Assessment is a certain percentage of the fair market value that is determined by local assessors to be the total taxable value of land and additions on the property. | Land | Improvement |
|---|---|---|---|---|
| 2025 | $7,306 | $38,556 | $12,043 | $26,513 |
| 2024 | $7,306 | $36,374 | $10,677 | $25,697 |
| 2023 | $7,184 | $35,770 | $11,606 | $24,164 |
| 2022 | $5,356 | $48,780 | $16,080 | $32,700 |
| 2021 | $7,167 | $46,740 | $16,080 | $30,660 |
| 2020 | $6,801 | $43,380 | $16,080 | $27,300 |
| 2019 | $6,341 | $44,580 | $16,080 | $28,500 |
| 2018 | $6,076 | $29,808 | $13,726 | $16,082 |
| 2017 | $5,777 | $29,808 | $15,073 | $14,735 |
| 2016 | $5,364 | $29,808 | $15,073 | $14,735 |
| 2015 | $3,178 | $26,775 | $15,926 | $10,849 |
| 2014 | $3,178 | $25,260 | $17,880 | $7,380 |
Source: Public Records
Map
Nearby Homes