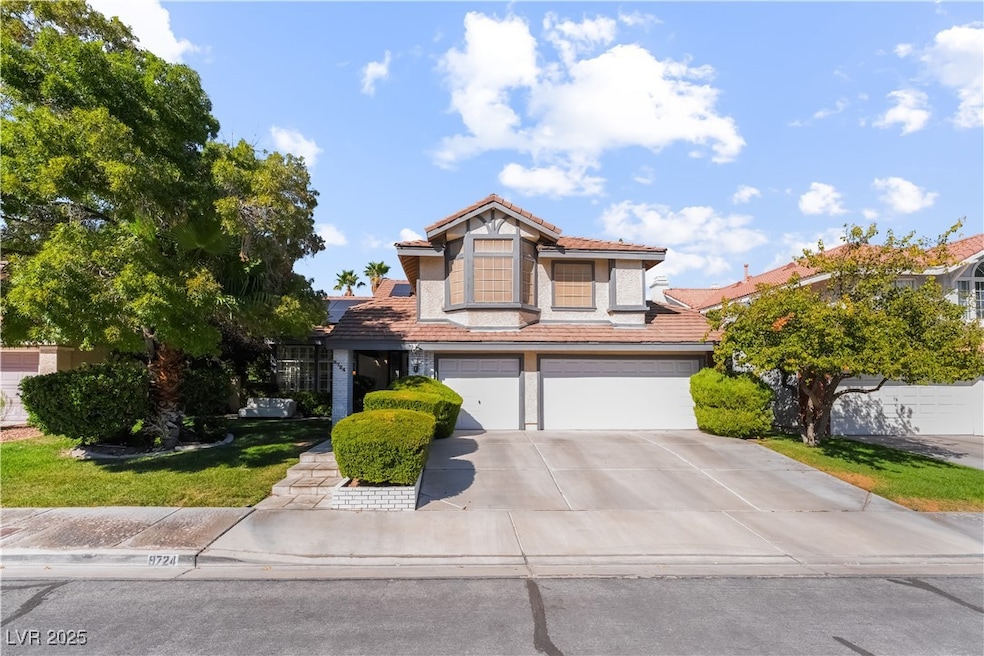
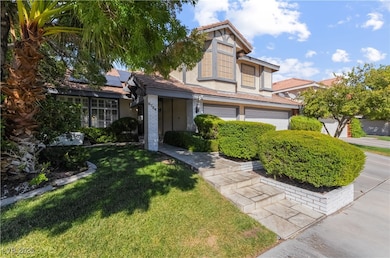
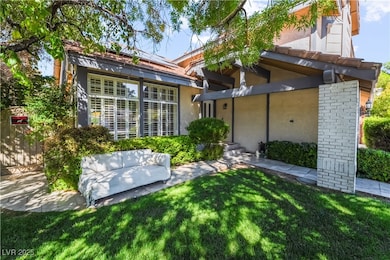
9724 Cascade Falls Ave Las Vegas, NV 89117
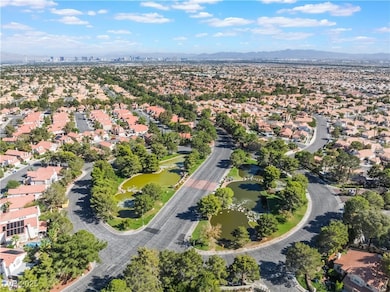
The Section Seven NeighborhoodEstimated payment $4,008/month
Highlights
- Popular Property
- Fruit Trees
- Main Floor Primary Bedroom
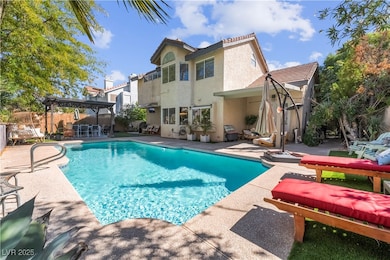
- In Ground Pool
- Fireplace in Bedroom
- Breakfast Area or Nook
About This Home
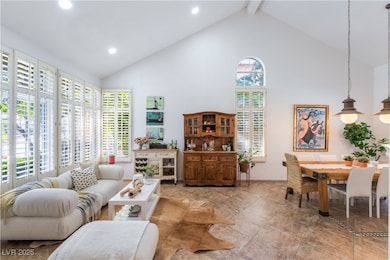
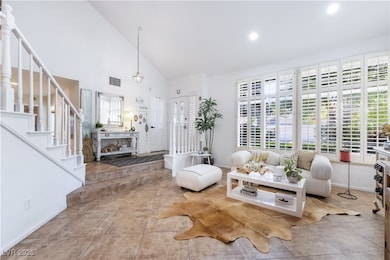
Luxury, Location & Lifestyle ~ Welcome to 9724 Cascade Falls Ave, a stunning 4-bed, 3-bath home in The Lakes WITH A MASSIVE SPARKLING POOL, COVERED PATIO AND PRIVATE BACKYARD MEANT FOR ENTERTAINING AND HOSTING YOUR FAMILY. Just minutes from Downtown Summerlin, Boca Park & Tivoli Village, All the dining & shopping you could ever need. Enjoy soaring ceilings, upgraded tile floors, and a renovated chef’s kitchen with a massive island and breakfast nook. Relax in the primary suite featuring a two-way fireplace, large tub, and walk-in closet. NOT ONLY IS THE PRIMARY BEDROOM LARGE, THE 2ND AND 3RD BEDROOMS UPSTAIRS ARE HUGE, twice the size of normal 2nd & 3rd bedrooms. YOU WILL NOT BELIEVE IT UNTIL YOU SEE IT. Step outside to your private backyard oasis with a sparkling pool, fruit trees. Low HOA, Paid Solar. ~ MUST SEE!
Listing Agent
Galindo Group Real Estate Brokerage Phone: (702) 588-4800 License #S.0176466 Listed on: 10/04/2025
Home Details
Home Type
- Single Family
Est. Annual Taxes
- $3,437
Year Built
- Built in 1989
Lot Details
- 6,970 Sq Ft Lot
- South Facing Home
- Dog Run
- Block Wall Fence
- Fruit Trees
- Back Yard Fenced and Front Yard
HOA Fees
- $35 Monthly HOA Fees
Parking
- 3 Car Attached Garage
Home Design
- Tile Roof
Interior Spaces
- 2,744 Sq Ft Home
- 2-Story Property
- Ceiling Fan
- Gas Fireplace
- Living Room with Fireplace
- 2 Fireplaces
- Prewired Security
Kitchen
- Breakfast Area or Nook
- Gas Range
- Microwave
- Dishwasher
- Pots and Pans Drawers
- Disposal
Flooring
- Carpet
- Laminate
Bedrooms and Bathrooms
- 4 Bedrooms
- Primary Bedroom on Main
- Fireplace in Bedroom
- 3 Full Bathrooms
Laundry
- Laundry Room
- Laundry on main level
- Dryer
- Washer
Schools
- Christensen Elementary School
- Fertitta Frank & Victoria Middle School
- Bonanza High School
Utilities
- Two cooling system units
- Central Heating and Cooling System
- Multiple Heating Units
- Heating System Uses Gas
- Underground Utilities
Additional Features
- Solar owned by seller
- In Ground Pool
Community Details
- Association fees include security
- Lakes Section 7 Association, Phone Number (702) 222-2391
- Lakes West #3 Lewis Homes Subdivision
- The community has rules related to covenants, conditions, and restrictions
Map
Home Values in the Area
Average Home Value in this Area
Tax History
| Year | Tax Paid | Tax Assessment Tax Assessment Total Assessment is a certain percentage of the fair market value that is determined by local assessors to be the total taxable value of land and additions on the property. | Land | Improvement |
|---|---|---|---|---|
| 2025 | $3,437 | $139,455 | $52,150 | $87,305 |
| 2024 | $3,297 | $139,455 | $52,150 | $87,305 |
| 2023 | $3,297 | $129,302 | $46,900 | $82,402 |
| 2022 | $3,201 | $115,770 | $39,550 | $76,220 |
| 2021 | $3,108 | $110,258 | $37,450 | $72,808 |
| 2020 | $3,014 | $106,539 | $33,950 | $72,589 |
| 2019 | $2,978 | $102,171 | $30,100 | $72,071 |
| 2018 | $2,841 | $97,675 | $28,000 | $69,675 |
| 2017 | $3,253 | $99,224 | $28,000 | $71,224 |
| 2016 | $2,660 | $92,262 | $20,650 | $71,612 |
| 2015 | $2,654 | $78,541 | $17,850 | $60,691 |
| 2014 | $2,577 | $80,870 | $12,250 | $68,620 |
Property History
| Date | Event | Price | List to Sale | Price per Sq Ft |
|---|---|---|---|---|
| 10/09/2025 10/09/25 | For Sale | $699,555 | -- | $255 / Sq Ft |
Purchase History
| Date | Type | Sale Price | Title Company |
|---|---|---|---|
| Bargain Sale Deed | $276,000 | Nevada Title Company | |
| Deed | $229,500 | Old Republic Title Company |
Mortgage History
| Date | Status | Loan Amount | Loan Type |
|---|---|---|---|
| Open | $193,200 | Stand Alone First | |
| Previous Owner | $183,600 | No Value Available |
Source: Las Vegas REALTORS®
MLS Number: 2723350
APN: 163-07-222-009
Disclaimer: Certain information contained herein is derived from information provided by parties other than Homes.com. All information provided is deemed reliable, but is not guaranteed to be accurate and should be independently verified.
![]() The data relating to real estate for sale on this web site comes in part from the INTERNET DATA EXCHANGE Program of the Greater Las Vegas Association of REALTORS® MLS. Real estate listings held by brokerage firms other than this site owner are marked with the IDX logo. Information is deemed reliable but not guaranteed. Copyright 2025 of the Greater Las Vegas Association of REALTORS® MLS. All rights reserved.
The data relating to real estate for sale on this web site comes in part from the INTERNET DATA EXCHANGE Program of the Greater Las Vegas Association of REALTORS® MLS. Real estate listings held by brokerage firms other than this site owner are marked with the IDX logo. Information is deemed reliable but not guaranteed. Copyright 2025 of the Greater Las Vegas Association of REALTORS® MLS. All rights reserved.
- 2929 Bridge Creek St
- 9708 Blazing Star Ct
- 9717 Sierra Mesa Ave
- 9624 Beach Water Cir
- 9605 Blowing Sand Cir
- 9548 Wooden Pier Way
- 2821 Willow Wind Ct
- 2728 Monrovia Dr
- 3144 Pelican Beach Dr Unit A
- 2724 Monrovia Dr
- 9917 Biscayne Ln
- 9544 Lazy River Dr
- 2909 Ivory Reef Ct
- 2820 Swallow Point Cir
- 9612 Chianti Ln
- 9504 Cliff View Way
- 9900 Meandering Creek Ct
- 9429 Abalone Way
- 3213 Shallow Point Cir
- 9833 Dardanelle Ct
- 9832 Cactus View Ave
- 2933 Morning Dew St
- 2932 Whalers Cove Cir
- 3128 Pelican Beach Dr
- 2805 Willow Wind Ct
- 9516 Wooden Pier Way
- 9509 Lazy River Dr
- 2701 Beachside Ct
- 9828 Dardanelle Ct
- 2824 Autumn Haze Ln
- 9836 Russett Wood Cir
- 9805 Cross Creek Way
- 9901 W Sahara Ave
- 3320 Haven Beach Way
- 9421 Salt Water Ct
- 9801 Concord Downs Ave
- 9645 Swan Bay Dr
- 10247 Splendor Ridge Ave
- 10263 Splendor Ridge Ave
- 9924 Oriole Crest Ct
