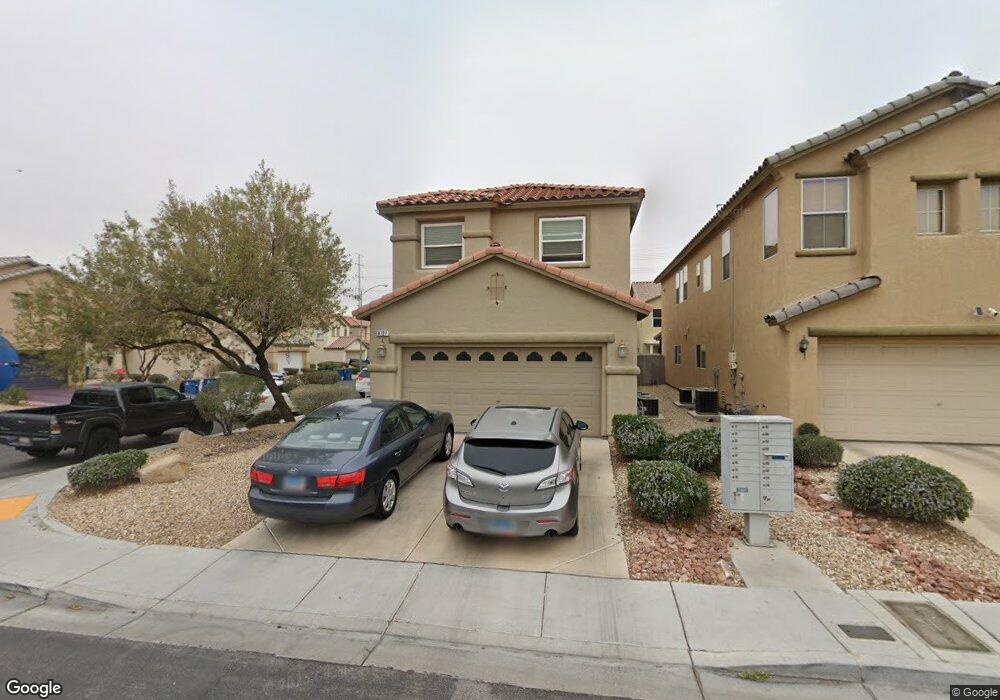
9727 Maple Sugar Leaf Place Las Vegas, NV 89148
Estimated Value: $480,000 - $519,000
3
Beds
3
Baths
2,034
Sq Ft
$244/Sq Ft
Est. Value
About This Home
This home is located at 9727 Maple Sugar Leaf Place, Las Vegas, NV 89148 and is currently estimated at $496,227, approximately $243 per square foot. 9727 Maple Sugar Leaf Place is a home located in Clark County with nearby schools including Kathy L. Batterman Elementary School, Victoria Fertitta Middle School, and Durango High School.
Ownership History
Date
Name
Owned For
Owner Type
Purchase Details
Closed on
Mar 2, 2009
Sold by
Fannie Mae
Bought by
Hathaway Renee
Current Estimated Value
Home Financials for this Owner
Home Financials are based on the most recent Mortgage that was taken out on this home.
Original Mortgage
$176,739
Outstanding Balance
$112,084
Interest Rate
5.08%
Mortgage Type
FHA
Estimated Equity
$384,143
Purchase Details
Closed on
Jul 26, 2008
Sold by
Hamathulin Jackla
Bought by
Federal National Mortgage Association
Purchase Details
Closed on
Aug 18, 2005
Sold by
Kb Home Nevada Inc
Bought by
Hamathulin Jackla
Home Financials for this Owner
Home Financials are based on the most recent Mortgage that was taken out on this home.
Original Mortgage
$291,900
Interest Rate
6.87%
Mortgage Type
New Conventional
Create a Home Valuation Report for This Property
The Home Valuation Report is an in-depth analysis detailing your home's value as well as a comparison with similar homes in the area
Home Values in the Area
Average Home Value in this Area
Purchase History
| Date | Buyer | Sale Price | Title Company |
|---|---|---|---|
| Hathaway Renee | $180,000 | Lawyers Title Of Nevada Cent | |
| Federal National Mortgage Association | $303,946 | Fidelity National | |
| Hamathulin Jackla | $364,875 | First Amer Title Co Of Nv |
Source: Public Records
Mortgage History
| Date | Status | Borrower | Loan Amount |
|---|---|---|---|
| Open | Hathaway Renee | $176,739 | |
| Previous Owner | Hamathulin Jackla | $291,900 |
Source: Public Records
Tax History Compared to Growth
Tax History
| Year | Tax Paid | Tax Assessment Tax Assessment Total Assessment is a certain percentage of the fair market value that is determined by local assessors to be the total taxable value of land and additions on the property. | Land | Improvement |
|---|---|---|---|---|
| 2025 | $2,213 | $129,581 | $43,750 | $85,831 |
| 2024 | $2,050 | $129,581 | $43,750 | $85,831 |
| 2023 | $2,050 | $117,370 | $36,400 | $80,970 |
| 2022 | $1,898 | $103,469 | $29,750 | $73,719 |
| 2021 | $1,758 | $97,678 | $27,650 | $70,028 |
| 2020 | $1,630 | $95,260 | $25,900 | $69,360 |
| 2019 | $1,527 | $91,392 | $23,450 | $67,942 |
| 2018 | $1,457 | $79,045 | $18,550 | $60,495 |
| 2017 | $2,249 | $76,696 | $16,800 | $59,896 |
| 2016 | $1,365 | $78,262 | $12,250 | $66,012 |
| 2015 | $1,362 | $62,147 | $10,850 | $51,297 |
| 2014 | $1,322 | $43,721 | $7,350 | $36,371 |
Source: Public Records
Map
Nearby Homes
- 9750 Maple Sugar Leaf Place
- 5697 Tapestry Rose Ct
- 5554 Chicory Falls Ct
- 5533 Sterling Valley Ct
- 9691 Loud Water Way
- 9580 Magnificent Ave
- 5674 Moccasin Point St
- 5634 Moccasin Point St
- 5526 Spruce Hill Ct
- 9472 W Diablo Dr
- 9687 Ridgebluff Ave
- 5736 Remy Rain St
- 9460 Magnificent Ave
- 10026 Indy Rey Ct
- 9631 Tuscola Ct
- 10034 Sir Atlas Ct
- 9862 Shadow Grove Ave
- 5915 Poplar Tree St Unit 7
- 5831 Sleepy Willow St
- 10138 Chasewood Ave
- 9733 Maple Sugar Leaf Place
- 9739 Maple Sugar Leaf Place
- 9724 Splendor Sky Ave
- 9730 Splendor Sky Ave
- 9745 Maple Sugar Leaf Place
- 5614 Thunder Spirit St
- 5606 Thunder Spirit St
- 9736 Splendor Sky Ave
- 9736 Splendor Sky Ave Unit n/a
- 5622 Thunder Spirit St
- 9751 Maple Sugar Leaf Place
- 5630 Thunder Spirit St
- 9742 Splendor Sky Ave
- 9726 Maple Sugar Leaf Place
- 9732 Maple Sugar Leaf Place
- 9720 Maple Sugar Leaf Place
- 9738 Maple Sugar Leaf Place
- 9714 Maple Sugar Leaf Place
- 5638 Thunder Spirit St
- 9748 Splendor Sky Ave