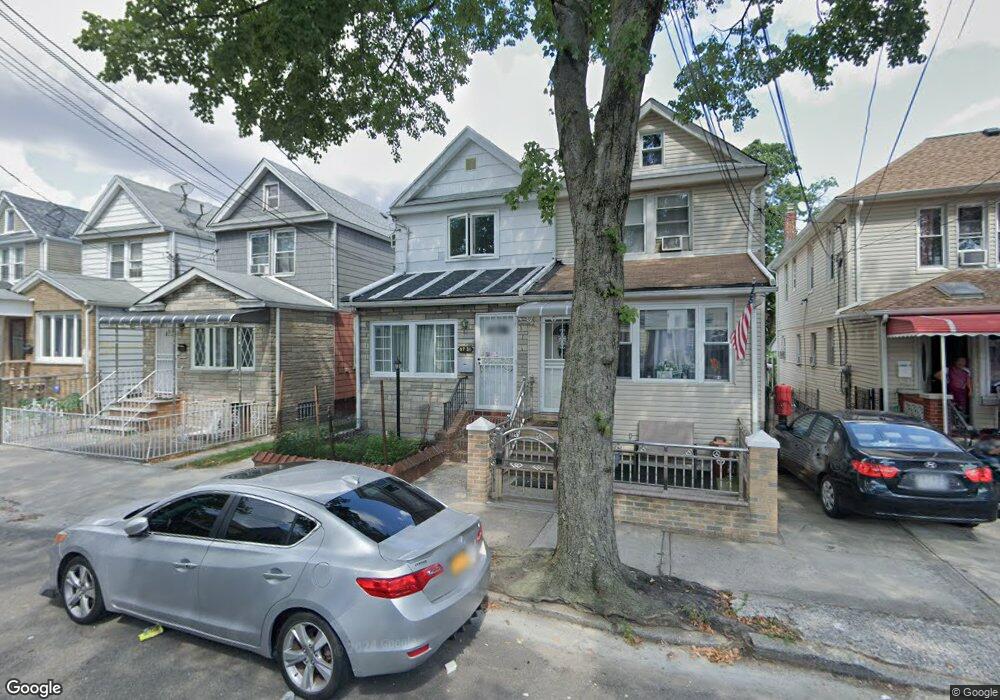
9729 84th St Ozone Park, NY 11416
Ozone Park NeighborhoodEstimated Value: $720,638 - $834,000
--
Bed
--
Bath
1,280
Sq Ft
$611/Sq Ft
Est. Value
About This Home
This home is located at 9729 84th St, Ozone Park, NY 11416 and is currently estimated at $782,660, approximately $611 per square foot. 9729 84th St is a home located in Queens County with nearby schools including P.S. 64 - Joseph P. Addabbo, Santiam Elementary School, and Jhs 210 Elizabeth Blackwell.
Ownership History
Date
Name
Owned For
Owner Type
Purchase Details
Closed on
Oct 29, 2004
Sold by
Phagu Rooplall and Phagu Seewnarine Naraindai
Bought by
Mandal Samir Kumar
Current Estimated Value
Home Financials for this Owner
Home Financials are based on the most recent Mortgage that was taken out on this home.
Original Mortgage
$44,000
Outstanding Balance
$21,762
Interest Rate
5.75%
Estimated Equity
$760,898
Purchase Details
Closed on
Aug 5, 1994
Sold by
Bastek Mieczyslaw and Basak Edward
Bought by
Phagu Rooplall and Seewnarine Naraindai
Home Financials for this Owner
Home Financials are based on the most recent Mortgage that was taken out on this home.
Original Mortgage
$93,750
Interest Rate
8.54%
Create a Home Valuation Report for This Property
The Home Valuation Report is an in-depth analysis detailing your home's value as well as a comparison with similar homes in the area
Home Values in the Area
Average Home Value in this Area
Purchase History
| Date | Buyer | Sale Price | Title Company |
|---|---|---|---|
| Mandal Samir Kumar | $440,000 | -- | |
| Mandal Samir Kumar | $440,000 | -- | |
| Phagu Rooplall | $125,000 | Chicago Title Insurance Co | |
| Phagu Rooplall | $125,000 | Chicago Title Insurance Co |
Source: Public Records
Mortgage History
| Date | Status | Borrower | Loan Amount |
|---|---|---|---|
| Open | Mandal Samir Kumar | $44,000 | |
| Closed | Mandal Samir Kumar | $44,000 | |
| Open | Mandal Samir Kumar | $352,000 | |
| Closed | Mandal Samir Kumar | $352,000 | |
| Previous Owner | Phagu Rooplall | $93,750 |
Source: Public Records
Tax History Compared to Growth
Tax History
| Year | Tax Paid | Tax Assessment Tax Assessment Total Assessment is a certain percentage of the fair market value that is determined by local assessors to be the total taxable value of land and additions on the property. | Land | Improvement |
|---|---|---|---|---|
| 2025 | $5,783 | $31,999 | $9,389 | $22,610 |
| 2024 | $5,795 | $30,191 | $10,619 | $19,572 |
| 2023 | $5,440 | $28,483 | $8,537 | $19,946 |
| 2022 | $5,078 | $46,920 | $13,380 | $33,540 |
| 2021 | $5,359 | $38,880 | $13,380 | $25,500 |
| 2020 | $5,348 | $39,960 | $13,380 | $26,580 |
| 2019 | $4,970 | $35,160 | $13,380 | $21,780 |
| 2018 | $4,541 | $23,736 | $11,097 | $12,639 |
| 2017 | $4,265 | $22,394 | $11,401 | $10,993 |
| 2016 | $4,167 | $22,394 | $11,401 | $10,993 |
| 2015 | $2,328 | $22,222 | $13,987 | $8,235 |
| 2014 | $2,328 | $20,966 | $13,197 | $7,769 |
Source: Public Records
Map
Nearby Homes