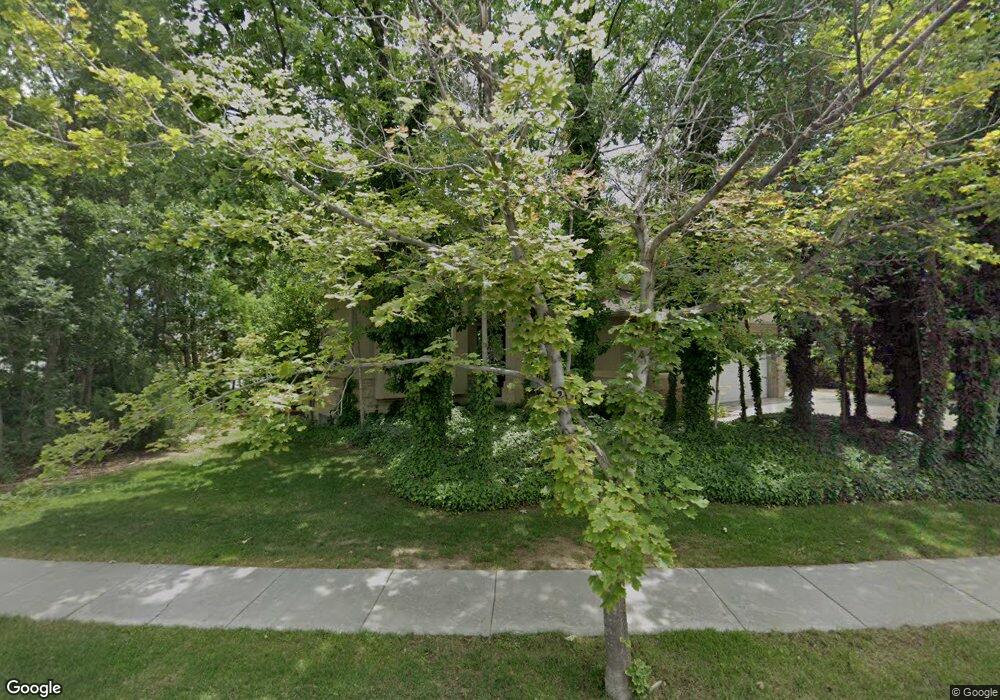
9729 Pine Meadow Way South Jordan, UT 84095
Estimated Value: $812,000 - $898,000
4
Beds
3
Baths
2,568
Sq Ft
$326/Sq Ft
Est. Value
About This Home
This home is located at 9729 Pine Meadow Way, South Jordan, UT 84095 and is currently estimated at $837,963, approximately $326 per square foot. 9729 Pine Meadow Way is a home located in Salt Lake County with nearby schools including Jordan Ridge School, South Jordan Middle School, and Hawthorn Academy.
Ownership History
Date
Name
Owned For
Owner Type
Purchase Details
Closed on
Apr 28, 2020
Sold by
Roberts Cole I and Roberts Colby J
Bought by
Roberts Julie C
Current Estimated Value
Purchase Details
Closed on
Mar 24, 2015
Sold by
Wieser Gary and Wieser Shirley A
Bought by
Roberts Cole J and Roberts Julie C
Home Financials for this Owner
Home Financials are based on the most recent Mortgage that was taken out on this home.
Original Mortgage
$300,000
Outstanding Balance
$229,515
Interest Rate
3.65%
Mortgage Type
New Conventional
Estimated Equity
$608,448
Purchase Details
Closed on
Jun 28, 2006
Sold by
Twin Peaks Financial Inc
Bought by
Wieser Gary W and Wieser Shirley A
Home Financials for this Owner
Home Financials are based on the most recent Mortgage that was taken out on this home.
Original Mortgage
$560,000
Interest Rate
6.57%
Mortgage Type
Purchase Money Mortgage
Create a Home Valuation Report for This Property
The Home Valuation Report is an in-depth analysis detailing your home's value as well as a comparison with similar homes in the area
Home Values in the Area
Average Home Value in this Area
Purchase History
| Date | Buyer | Sale Price | Title Company |
|---|---|---|---|
| Roberts Julie C | -- | None Available | |
| Roberts Cole J | -- | Meridian Title | |
| Wieser Gary W | -- | Meridian Title |
Source: Public Records
Mortgage History
| Date | Status | Borrower | Loan Amount |
|---|---|---|---|
| Open | Roberts Cole J | $300,000 | |
| Previous Owner | Wieser Gary W | $560,000 |
Source: Public Records
Tax History Compared to Growth
Tax History
| Year | Tax Paid | Tax Assessment Tax Assessment Total Assessment is a certain percentage of the fair market value that is determined by local assessors to be the total taxable value of land and additions on the property. | Land | Improvement |
|---|---|---|---|---|
| 2025 | $3,895 | $761,300 | $220,100 | $541,200 |
| 2024 | $3,895 | $739,500 | $213,100 | $526,400 |
| 2023 | $3,986 | $714,000 | $201,000 | $513,000 |
| 2022 | $4,181 | $734,200 | $197,100 | $537,100 |
| 2021 | $3,479 | $560,400 | $132,300 | $428,100 |
| 2020 | $3,328 | $502,600 | $132,300 | $370,300 |
| 2019 | $3,300 | $489,900 | $124,800 | $365,100 |
| 2018 | $3,135 | $463,000 | $124,800 | $338,200 |
| 2017 | $2,874 | $416,000 | $124,800 | $291,200 |
| 2016 | $2,932 | $402,100 | $124,800 | $277,300 |
| 2015 | $2,794 | $372,600 | $159,300 | $213,300 |
| 2014 | $2,677 | $350,800 | $151,900 | $198,900 |
Source: Public Records
Map
Nearby Homes
- 2246 Country Bend Dr Unit 25
- 1788 W Ikaros Ln
- 9496 S 1930 W
- 1891 Orchard View Cir
- 1767 W Ikaros Ln
- 1741 W Nikos Ln
- 1718 W Thira Ln
- 9414 S 1980 W
- 2097 Jordan Villa Dr
- 2439 Bridle Oak Dr
- 2551 W Winding Way
- 2375 Bonanza Way
- 1719 W Brocious Way Unit 301
- Brook Haven Plan at Jordan Woods
- Maple Plan at Jordan Woods
- The Maple Basement Plan at Jordan Woods
- The Evergreen Basement Plan at Jordan Woods
- 9503 S Tirado Cove Unit 203
- 9511 S Tirado Cove Unit 204
- 1753 Rylie Ann Cir
- 9729 S Pine Meadow Way
- 9753 Pine Meadow Way
- 9721 Pine Brook Dr
- 9721 S Pine Brook Dr
- 9706 S Pine Meadow Way
- 9706 Pine Meadow Way
- 9701 Pine Brook Dr
- 9724 Pine Meadow Way
- 9743 Pine Brook Dr
- 9743 S Pine Brook Dr
- 9738 Pine Meadow Way
- 9754 Pine Meadow Way
- 9757 Pine Brook Dr
- 9689 S 2200 W
- 9696 Pine Brook Dr
- 9779 Pine Meadow Way
- 9768 S Pine Meadow Way
- 2118 W 9800 S
- 9763 Pine Meadow Way
- 9768 S Pine Meadow Way