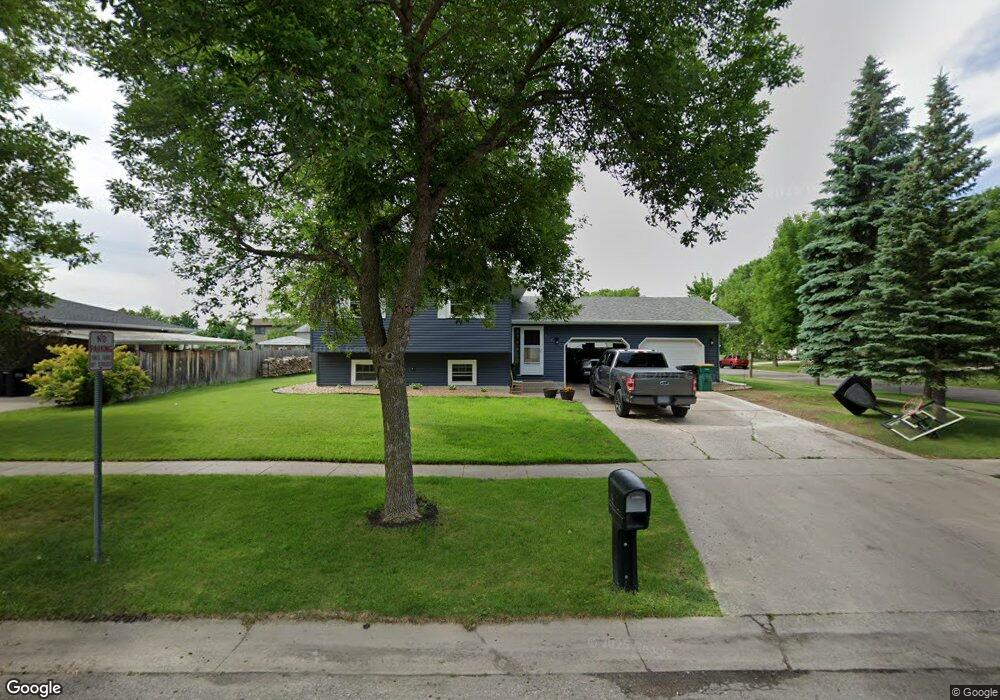
973 6th Ave W West Fargo, ND 58078
West Side NeighborhoodEstimated Value: $315,000
4
Beds
2
Baths
1,152
Sq Ft
$273/Sq Ft
Est. Value
About This Home
This home is located at 973 6th Ave W, West Fargo, ND 58078 and is currently estimated at $315,000, approximately $273 per square foot. 973 6th Ave W is a home located in Cass County with nearby schools including Westside Elementary School, Cheney Middle School, and West Fargo High School.
Ownership History
Date
Name
Owned For
Owner Type
Purchase Details
Closed on
Aug 8, 2025
Sold by
Wileman Joanne M
Bought by
Wileman Kari and Depiano Dustin
Current Estimated Value
Home Financials for this Owner
Home Financials are based on the most recent Mortgage that was taken out on this home.
Original Mortgage
$301,439
Outstanding Balance
$301,180
Interest Rate
6.77%
Mortgage Type
FHA
Estimated Equity
$13,820
Purchase Details
Closed on
May 20, 2019
Sold by
Wileman David E and Wileman Joanne M
Bought by
Wileman Joanne M
Purchase Details
Closed on
Jun 5, 2008
Sold by
Redlin Daniel W and Redlin Darlene G
Bought by
Ackerman Stacey J and Pringle Todd A
Create a Home Valuation Report for This Property
The Home Valuation Report is an in-depth analysis detailing your home's value as well as a comparison with similar homes in the area
Home Values in the Area
Average Home Value in this Area
Purchase History
| Date | Buyer | Sale Price | Title Company |
|---|---|---|---|
| Wileman Kari | $307,000 | None Listed On Document | |
| Wileman Joanne M | -- | None Available | |
| Ackerman Stacey J | -- | -- |
Source: Public Records
Mortgage History
| Date | Status | Borrower | Loan Amount |
|---|---|---|---|
| Open | Wileman Kari | $301,439 |
Source: Public Records
Tax History Compared to Growth
Tax History
| Year | Tax Paid | Tax Assessment Tax Assessment Total Assessment is a certain percentage of the fair market value that is determined by local assessors to be the total taxable value of land and additions on the property. | Land | Improvement |
|---|---|---|---|---|
| 2024 | $4,381 | $144,300 | $25,000 | $119,300 |
| 2023 | $4,409 | $145,650 | $25,000 | $120,650 |
| 2022 | $4,162 | $130,500 | $25,000 | $105,500 |
| 2021 | $3,900 | $117,250 | $20,000 | $97,250 |
| 2020 | $3,857 | $117,000 | $20,000 | $97,000 |
| 2019 | $3,495 | $103,350 | $20,000 | $83,350 |
| 2018 | $3,255 | $103,350 | $20,000 | $83,350 |
| 2017 | $2,846 | $100,100 | $20,000 | $80,100 |
| 2016 | $2,382 | $97,050 | $20,000 | $77,050 |
| 2015 | $2,059 | $76,550 | $14,200 | $62,350 |
| 2014 | $2,014 | $71,550 | $14,200 | $57,350 |
| 2013 | $1,890 | $67,800 | $14,200 | $53,600 |
Source: Public Records
Map
Nearby Homes