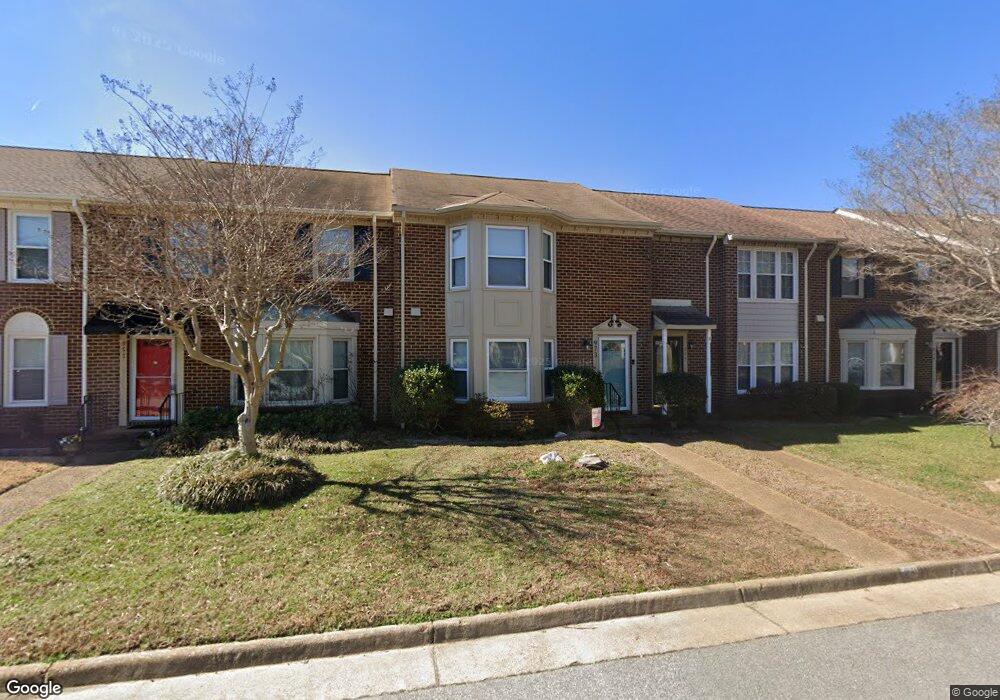
973 Colonial Meadows Way Virginia Beach, VA 23454
Great Neck NeighborhoodEstimated Value: $395,912 - $408,000
3
Beds
3
Baths
1,664
Sq Ft
$242/Sq Ft
Est. Value
About This Home
This home is located at 973 Colonial Meadows Way, Virginia Beach, VA 23454 and is currently estimated at $402,728, approximately $242 per square foot. 973 Colonial Meadows Way is a home located in Virginia Beach City with nearby schools including Alanton Elementary School, Lynnhaven Middle School, and First Colonial High School.
Ownership History
Date
Name
Owned For
Owner Type
Purchase Details
Closed on
May 15, 2024
Sold by
Reed Kaye M and Kelley John H
Bought by
Foster John K and Foster Karol L
Current Estimated Value
Purchase Details
Closed on
Aug 3, 2009
Sold by
Elliott James
Bought by
Jernigan Alice Kelley
Home Financials for this Owner
Home Financials are based on the most recent Mortgage that was taken out on this home.
Original Mortgage
$245,650
Interest Rate
5.19%
Mortgage Type
New Conventional
Purchase Details
Closed on
Jul 17, 2001
Sold by
Graham Deanna Louise
Bought by
Elliott James
Home Financials for this Owner
Home Financials are based on the most recent Mortgage that was taken out on this home.
Original Mortgage
$100,000
Interest Rate
7.2%
Purchase Details
Closed on
Aug 27, 1999
Sold by
Johnson Bobby G
Bought by
Schrantz Deanna L
Home Financials for this Owner
Home Financials are based on the most recent Mortgage that was taken out on this home.
Original Mortgage
$129,950
Interest Rate
7.85%
Create a Home Valuation Report for This Property
The Home Valuation Report is an in-depth analysis detailing your home's value as well as a comparison with similar homes in the area
Home Values in the Area
Average Home Value in this Area
Purchase History
| Date | Buyer | Sale Price | Title Company |
|---|---|---|---|
| Foster John K | $386,000 | None Listed On Document | |
| Jernigan Alice Kelley | $289,000 | -- | |
| Elliott James | $147,000 | -- | |
| Schrantz Deanna L | $134,000 | -- |
Source: Public Records
Mortgage History
| Date | Status | Borrower | Loan Amount |
|---|---|---|---|
| Previous Owner | Jernigan Alice Kelley | $245,650 | |
| Previous Owner | Elliott James | $100,000 | |
| Previous Owner | Schrantz Deanna L | $129,950 |
Source: Public Records
Tax History Compared to Growth
Tax History
| Year | Tax Paid | Tax Assessment Tax Assessment Total Assessment is a certain percentage of the fair market value that is determined by local assessors to be the total taxable value of land and additions on the property. | Land | Improvement |
|---|---|---|---|---|
| 2025 | $3,213 | $346,000 | $145,000 | $201,000 |
| 2024 | $3,213 | $331,200 | $145,000 | $186,200 |
| 2023 | $3,184 | $321,600 | $135,000 | $186,600 |
| 2022 | $2,868 | $289,700 | $115,000 | $174,700 |
| 2021 | $2,700 | $272,700 | $98,000 | $174,700 |
| 2020 | $2,666 | $262,000 | $98,000 | $164,000 |
| 2019 | $2,516 | $244,500 | $98,000 | $146,500 |
| 2018 | $2,451 | $244,500 | $98,000 | $146,500 |
| 2017 | $2,341 | $233,500 | $91,000 | $142,500 |
| 2016 | $2,263 | $228,600 | $90,300 | $138,300 |
| 2015 | $2,290 | $231,300 | $103,700 | $127,600 |
| 2014 | $2,250 | $237,700 | $109,800 | $127,900 |
Source: Public Records
Map
Nearby Homes
- 1833 Chantilly Ct Unit 305
- 909 Royal Cove Way
- MM Chelsea @ Prosperity
- MM Woodside @ Prosperity
- The Chelsea Plan at Prosperity At The Pines
- The Leigh Plan at Prosperity At The Pines
- The Harriet Plan at Prosperity At The Pines
- The Dimitri Plan at Prosperity At The Pines
- The Savannah Plan at Prosperity At The Pines
- The Augusta Plan at Prosperity At The Pines
- 1880 Chantilly Ct Unit 1001
- 1501 N Horseshoe Cir
- 1500 Horse Point Ct
- 914 Wildwood Square Ct
- 813 Ray Place
- 1877 Calash Way
- 932 N Hilltop Rd
- 1049 Hanson Way
- 1024 Autumn Woods Ln Unit 111
- 1513 Quail Point Rd
- 975 Colonial Meadows Way
- 971 Colonial Meadows Way
- 977 Colonial Meadows Way
- 969 Colonial Meadows Way
- 979 Colonial Meadows Way
- 967 Colonial Meadows Way
- 981 Colonial Meadows Way
- 965 Colonial Meadows Way
- 983 Colonial Meadows Way
- 963 Colonial Meadows Way
- 987 Colonial Meadows Way
- 961 Colonial Meadows Way
- 972 Colonial Meadows Way
- 974 Colonial Meadows Way
- 976 Colonial Meadows Way
- 970 Colonial Meadows Way
- 989 Colonial Meadows Way
- 968 Colonial Meadows Way
- 980 Colonial Meadows Way
- 959 Colonial Meadows Way