973 E Weber Rd Columbus, OH 43211
North Linden NeighborhoodEstimated Value: $112,661 - $144,000
2
Beds
1
Bath
672
Sq Ft
$192/Sq Ft
Est. Value
About This Home
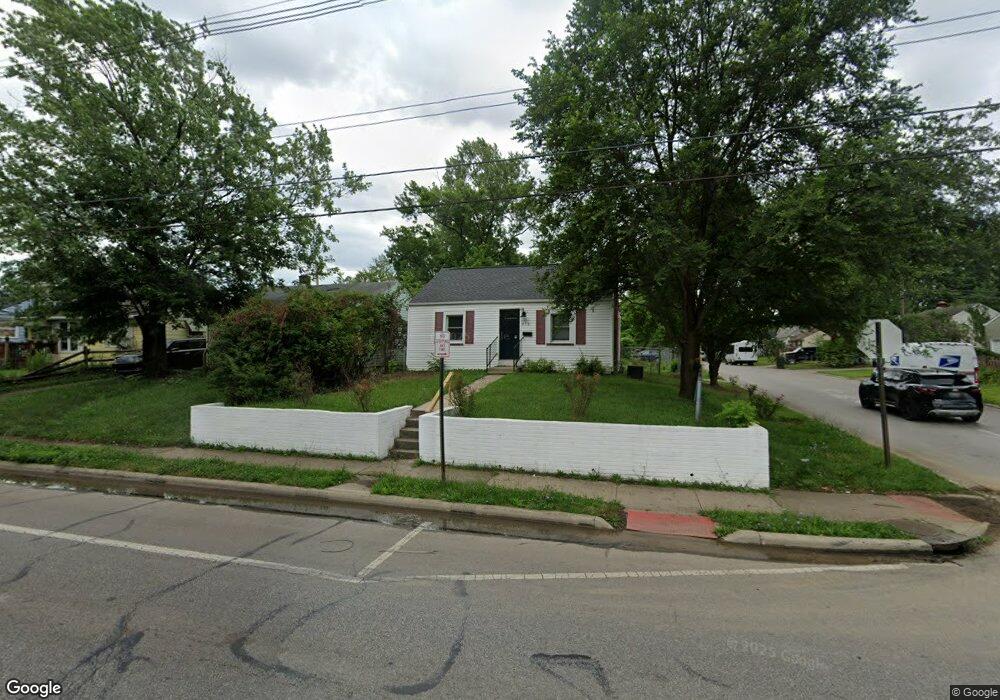
This home is located at 973 E Weber Rd, Columbus, OH 43211 and is currently estimated at $128,915, approximately $191 per square foot. 973 E Weber Rd is a home located in Franklin County with nearby schools including Linden-Mckinley Stem School On Arcadia, Focus Learning Academy of Central Columbus, and Road To Success Academy.
Ownership History
Date
Name
Owned For
Owner Type
Purchase Details
Closed on
Jul 23, 2021
Sold by
Underwood Ronald F
Bought by
Clarizio Properties Llc
Current Estimated Value
Home Financials for this Owner
Home Financials are based on the most recent Mortgage that was taken out on this home.
Original Mortgage
$65,400
Interest Rate
2.9%
Mortgage Type
Construction
Purchase Details
Closed on
Jul 9, 2021
Sold by
Mcgee Adriann S and Estate Of Ronald F
Bought by
Clarizio Properties Llc
Home Financials for this Owner
Home Financials are based on the most recent Mortgage that was taken out on this home.
Original Mortgage
$65,400
Interest Rate
2.9%
Mortgage Type
Construction
Purchase Details
Closed on
May 1, 2000
Sold by
Evans Carl and Evans Florence
Bought by
Underwood Ronald F
Home Financials for this Owner
Home Financials are based on the most recent Mortgage that was taken out on this home.
Original Mortgage
$56,953
Interest Rate
8.24%
Mortgage Type
FHA
Purchase Details
Closed on
Feb 18, 1993
Bought by
Evans Carl and Evans Florence
Create a Home Valuation Report for This Property
The Home Valuation Report is an in-depth analysis detailing your home's value as well as a comparison with similar homes in the area
Home Values in the Area
Average Home Value in this Area
Purchase History
| Date | Buyer | Sale Price | Title Company |
|---|---|---|---|
| Clarizio Properties Llc | $16,666 | Associates Title | |
| Clarizio Properties Llc | $50,000 | Associates Title Inc | |
| Underwood Ronald F | $58,000 | -- | |
| Evans Carl | -- | -- |
Source: Public Records
Mortgage History
| Date | Status | Borrower | Loan Amount |
|---|---|---|---|
| Previous Owner | Clarizio Properties Llc | $65,400 | |
| Previous Owner | Clarizio Properties Llc | $65,400 | |
| Previous Owner | Underwood Ronald F | $56,953 |
Source: Public Records
Tax History
| Year | Tax Paid | Tax Assessment Tax Assessment Total Assessment is a certain percentage of the fair market value that is determined by local assessors to be the total taxable value of land and additions on the property. | Land | Improvement |
|---|---|---|---|---|
| 2025 | $1,615 | $35,250 | $9,280 | $25,970 |
| 2024 | $1,615 | $35,250 | $9,280 | $25,970 |
| 2023 | $1,595 | $35,245 | $9,275 | $25,970 |
| 2022 | $1,277 | $22,860 | $4,940 | $17,920 |
| 2021 | $801 | $22,860 | $4,940 | $17,920 |
| 2020 | $734 | $22,860 | $4,940 | $17,920 |
| 2019 | $659 | $19,610 | $4,310 | $15,300 |
| 2018 | $524 | $19,610 | $4,310 | $15,300 |
| 2017 | $544 | $19,610 | $4,310 | $15,300 |
| 2016 | $429 | $15,230 | $3,360 | $11,870 |
| 2015 | $390 | $15,230 | $3,360 | $11,870 |
| 2014 | $391 | $15,230 | $3,360 | $11,870 |
| 2013 | $273 | $17,920 | $3,955 | $13,965 |
Source: Public Records
Map
Nearby Homes
- 964 E Weber Rd
- 2752 Azelda St
- 2905 Hiawatha St
- 2872 Howey Rd
- 2888 Howey Rd
- 2874 Grasmere Ave
- 2696 Grasmere Ave
- 2610 Atwood Terrace
- 2950 Grasmere Ave
- 816 Melrose Ave
- 2992 Howey Rd
- 2610 Grasmere Ave
- 2595 Grasmere Ave
- 1166 Minnesota Ave
- 792 Melrose Ave
- 3035 Audubon Rd
- 773 Melrose Ave
- 1222 Manchester Ave
- 3077 Pontiac St
- 1199 Minnesota Ave
- 979 E Weber Rd
- 0 Hiawatha St
- 983 E Weber Rd
- 961 E Weber Rd
- 2834 Hiawatha St
- 989 E Weber Rd
- 957 E Weber Rd
- 2828 Hiawatha St
- 2835 Hiawatha St
- 2824 Hiawatha St
- 995 E Weber Rd
- 953 E Weber Rd
- 974 E Weber Rd
- 984 E Weber Rd
- 2823 Atwood Terrace
- 1001 E Weber Rd
- 2820 Hiawatha St
- 947 E Weber Rd
- 2821 Atwood Terrace
- 988 E Weber Rd
Your Personal Tour Guide
Ask me questions while you tour the home.