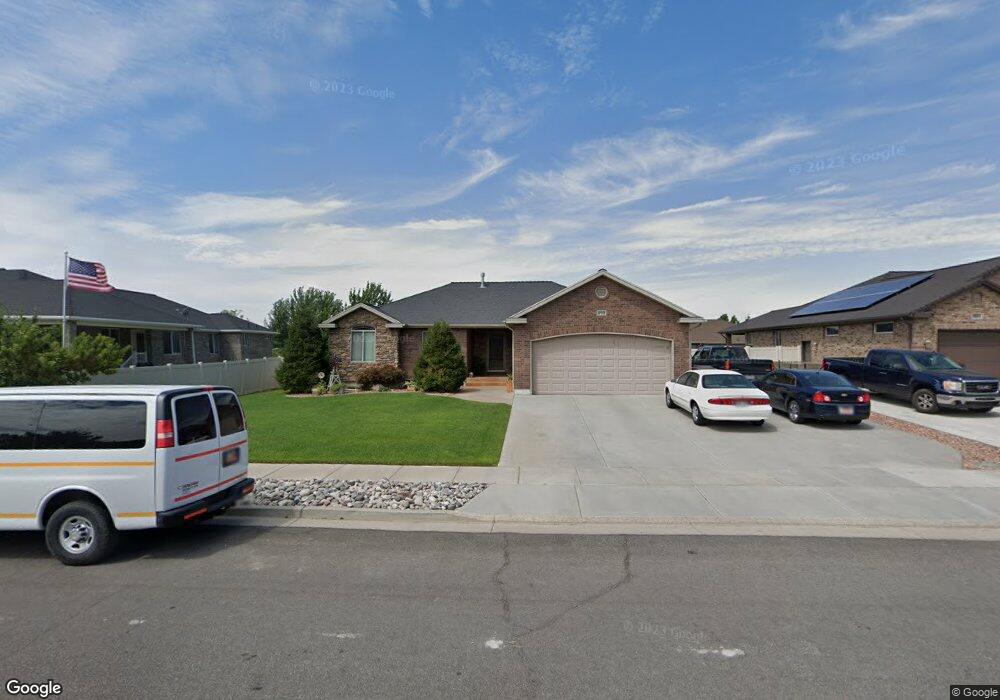
973 N 1285 W Clearfield, UT 84015
Estimated Value: $519,000 - $637,000
4
Beds
2
Baths
3,064
Sq Ft
$184/Sq Ft
Est. Value
About This Home
This home is located at 973 N 1285 W, Clearfield, UT 84015 and is currently estimated at $562,747, approximately $183 per square foot. 973 N 1285 W is a home located in Davis County with nearby schools including Clinton Elementary School, Sunset Junior High School, and Clearfield High School.
Ownership History
Date
Name
Owned For
Owner Type
Purchase Details
Closed on
Apr 18, 2008
Sold by
Mcmerrick Michael J
Bought by
Mcmerrick Michael J and Mcmerrick Heather M
Current Estimated Value
Home Financials for this Owner
Home Financials are based on the most recent Mortgage that was taken out on this home.
Original Mortgage
$219,860
Outstanding Balance
$139,418
Interest Rate
5.99%
Mortgage Type
Purchase Money Mortgage
Estimated Equity
$423,329
Purchase Details
Closed on
Oct 12, 2007
Sold by
Kecher Development Llc
Bought by
Ken Mitchell Development Co Inc
Create a Home Valuation Report for This Property
The Home Valuation Report is an in-depth analysis detailing your home's value as well as a comparison with similar homes in the area
Home Values in the Area
Average Home Value in this Area
Purchase History
| Date | Buyer | Sale Price | Title Company |
|---|---|---|---|
| Mcmerrick Michael J | -- | Founders Title Co Layton | |
| Mcmerrick Michael J | -- | Founders Title Co Layton | |
| Ken Mitchell Development Co Inc | -- | Founders Title Co Layton |
Source: Public Records
Mortgage History
| Date | Status | Borrower | Loan Amount |
|---|---|---|---|
| Open | Mcmerrick Michael J | $219,860 |
Source: Public Records
Tax History Compared to Growth
Tax History
| Year | Tax Paid | Tax Assessment Tax Assessment Total Assessment is a certain percentage of the fair market value that is determined by local assessors to be the total taxable value of land and additions on the property. | Land | Improvement |
|---|---|---|---|---|
| 2025 | $2,917 | $280,500 | $92,179 | $188,321 |
| 2024 | $2,800 | $270,600 | $101,135 | $169,465 |
| 2023 | $2,661 | $476,000 | $115,398 | $360,602 |
| 2022 | $2,824 | $279,400 | $70,185 | $209,215 |
| 2021 | $2,603 | $382,000 | $88,547 | $293,453 |
| 2020 | $2,300 | $334,000 | $75,603 | $258,397 |
| 2019 | $2,262 | $321,000 | $87,675 | $233,325 |
| 2018 | $2,181 | $304,000 | $66,003 | $237,997 |
| 2016 | $1,903 | $137,005 | $31,146 | $105,859 |
| 2015 | $1,954 | $133,760 | $31,146 | $102,614 |
| 2014 | $1,901 | $132,171 | $31,146 | $101,025 |
| 2013 | -- | $117,387 | $31,020 | $86,367 |
Source: Public Records
Map
Nearby Homes
- 1242 W 1075 N
- 984 N 1100 W
- 1122 N 1500 W
- 1038 W 800 N
- 1121 N 900 W
- 620 N 1100 W
- 563 N 1350 W Unit 139
- 1350 W 300 N Unit 49
- 1350 W 300 N Unit 38
- 1350 W 300 N Unit 29
- 1337 W 550 N Unit 195
- 1463 N 1250 W
- 1479 N 1320 W
- 575 N 1350 W Unit 137
- 1652 W 560 N
- 1827 W 775 N
- 1832 W 725 N
- 1132 N 780 W
- 423 N 1250 W Unit 118
- 1805 W 675 N