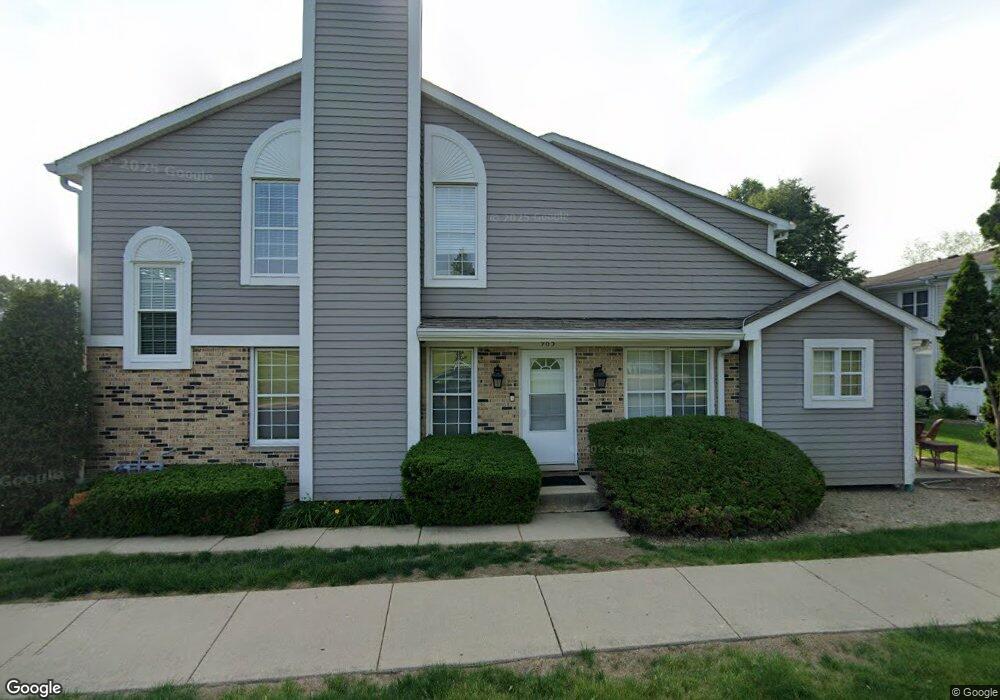
973 N Cove Dr Unit 973C Palatine, IL 60067
Baldwin NeighborhoodEstimated Value: $303,000 - $414,000
2
Beds
--
Bath
1,634
Sq Ft
$213/Sq Ft
Est. Value
About This Home
This home is located at 973 N Cove Dr Unit 973C, Palatine, IL 60067 and is currently estimated at $348,367, approximately $213 per square foot. 973 N Cove Dr Unit 973C is a home located in Cook County with nearby schools including Gray M Sanborn Elementary School, Walter R. Sundling Junior High School, and Palatine High School.
Ownership History
Date
Name
Owned For
Owner Type
Purchase Details
Closed on
Aug 15, 2001
Sold by
Franzwa Paul E and Franzwa Laura M
Bought by
Kwak Chung N and Kwak In S
Current Estimated Value
Home Financials for this Owner
Home Financials are based on the most recent Mortgage that was taken out on this home.
Original Mortgage
$213,300
Outstanding Balance
$83,686
Interest Rate
7.23%
Estimated Equity
$264,681
Purchase Details
Closed on
Jul 27, 1998
Sold by
Vanek Dean P and Haeger Vanek Mary E
Bought by
Franzwa Paul E and Zidek Laura M
Home Financials for this Owner
Home Financials are based on the most recent Mortgage that was taken out on this home.
Original Mortgage
$143,200
Interest Rate
7.03%
Mortgage Type
Balloon
Purchase Details
Closed on
Oct 25, 1995
Sold by
Broulette Helen M and Devaney Eileen M
Bought by
Vanek Dean P and Vanek Mary E Haeger
Home Financials for this Owner
Home Financials are based on the most recent Mortgage that was taken out on this home.
Original Mortgage
$162,650
Interest Rate
7.61%
Create a Home Valuation Report for This Property
The Home Valuation Report is an in-depth analysis detailing your home's value as well as a comparison with similar homes in the area
Home Values in the Area
Average Home Value in this Area
Purchase History
| Date | Buyer | Sale Price | Title Company |
|---|---|---|---|
| Kwak Chung N | $237,000 | -- | |
| Franzwa Paul E | $179,000 | -- | |
| Vanek Dean P | $171,500 | -- |
Source: Public Records
Mortgage History
| Date | Status | Borrower | Loan Amount |
|---|---|---|---|
| Open | Kwak Chung N | $213,300 | |
| Previous Owner | Franzwa Paul E | $143,200 | |
| Previous Owner | Vanek Dean P | $162,650 |
Source: Public Records
Tax History Compared to Growth
Tax History
| Year | Tax Paid | Tax Assessment Tax Assessment Total Assessment is a certain percentage of the fair market value that is determined by local assessors to be the total taxable value of land and additions on the property. | Land | Improvement |
|---|---|---|---|---|
| 2024 | $5,561 | $24,753 | $2,802 | $21,951 |
| 2023 | $5,326 | $24,753 | $2,802 | $21,951 |
| 2022 | $5,326 | $24,753 | $2,802 | $21,951 |
| 2021 | $4,574 | $20,744 | $1,634 | $19,110 |
| 2020 | $4,269 | $20,744 | $1,634 | $19,110 |
| 2019 | $4,230 | $23,093 | $1,634 | $21,459 |
| 2018 | $4,592 | $21,766 | $1,517 | $20,249 |
| 2017 | $4,427 | $21,766 | $1,517 | $20,249 |
| 2016 | $4,958 | $21,766 | $1,517 | $20,249 |
| 2015 | $7,607 | $24,758 | $1,400 | $23,358 |
| 2014 | $7,514 | $24,758 | $1,400 | $23,358 |
| 2013 | $7,322 | $24,758 | $1,400 | $23,358 |
Source: Public Records
Map
Nearby Homes
- 1068 N Coolidge Ave
- 1020 W Sutton Ct Unit 30
- 1049 W Sutton Ct Unit 13
- 842 N Maple Ave Unit 44
- 1022 N Knollwood Dr
- 1213 W Northwest Hwy
- 1102 N Knollwood Dr
- 667 N Morrison Ave
- 1124 W Colfax St
- 1230 W Claridge Ct
- 882 N Franklin Ave
- 870 N Quentin Rd
- 884 N Quentin Rd
- 805 W Poplar St
- 552 N Quentin Rd
- 1255 N Sterling Ave Unit 208
- 1295 N Sterling Ave Unit 212
- 1048 N Palos Ave
- 580 N Quentin Rd
- 550 N Quentin Rd
- 977 N Cove Dr Unit 977D
- 965 N Cove Dr Unit 965B
- 981 N Cove Dr Unit 981E
- 985 N Cove Dr Unit 985F
- 957 N Cove Dr Unit 957F
- 953 N Cove Dr Unit 953D
- 949 N Cove Dr Unit 949C
- 949 N Cove Dr Unit C
- 961 N Cove Dr Unit 961E
- 945 N Cove Dr Unit 945B
- 945 N Cove Dr Unit B
- 941 N Cove Dr Unit 947
- 941 N Cove Dr Unit 941A
- 989 N Cove Dr Unit 989B
- 993 N Cove Dr Unit 993A
- 997 N Cove Dr Unit 997D
- 1001 N Cove Dr Unit 1005F
- 1001 N Cove Dr Unit 1
- 915 N Sterling Ave Unit 107
- 915 N Sterling Ave Unit 108