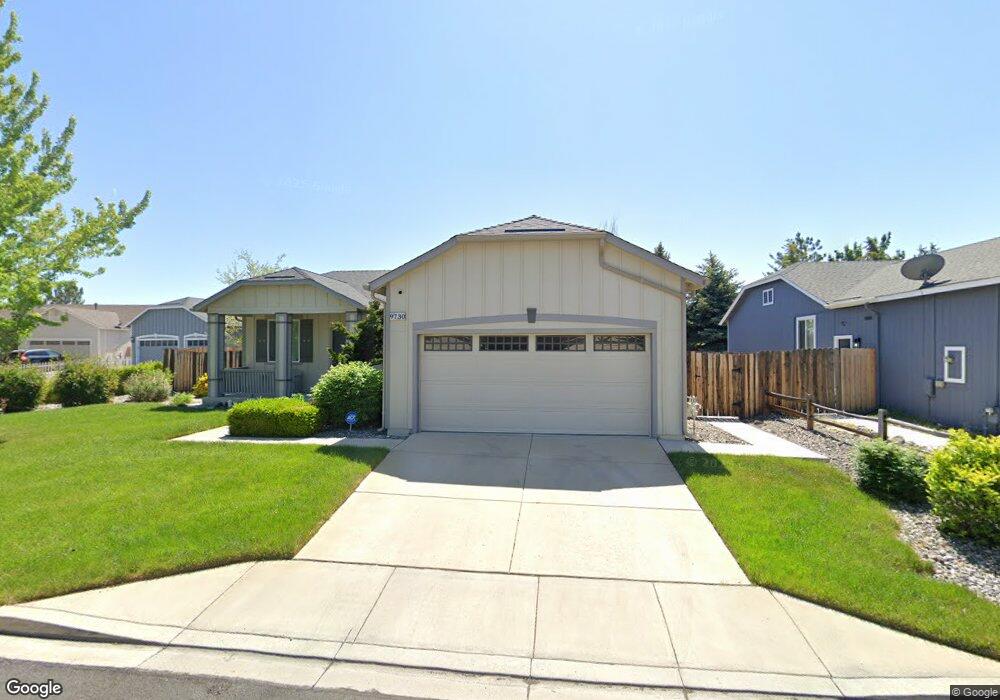
9730 Stone Vista Ct Reno, NV 89506
Stead NeighborhoodEstimated Value: $422,028 - $437,000
3
Beds
2
Baths
1,440
Sq Ft
$299/Sq Ft
Est. Value
About This Home
This home is located at 9730 Stone Vista Ct, Reno, NV 89506 and is currently estimated at $430,507, approximately $298 per square foot. 9730 Stone Vista Ct is a home located in Washoe County with nearby schools including Stead Elementary School, William O'Brien Middle School, and North Valleys High School.
Ownership History
Date
Name
Owned For
Owner Type
Purchase Details
Closed on
Dec 13, 2019
Sold by
Salmassian Vahab and Salmassian Gwendolyn J
Bought by
Salmassian Vahab and Salmassian Gwendolyn J
Current Estimated Value
Purchase Details
Closed on
Feb 23, 2007
Sold by
Jenkins Shawn M
Bought by
Salmassian Vahab and Salmassian Gwendolyn J
Home Financials for this Owner
Home Financials are based on the most recent Mortgage that was taken out on this home.
Original Mortgage
$199,200
Outstanding Balance
$120,699
Interest Rate
6.37%
Mortgage Type
Unknown
Estimated Equity
$309,808
Purchase Details
Closed on
Nov 4, 1999
Sold by
Neuffer Homes & Development Inc
Bought by
Lau Randy I and Lau Roxanne A
Home Financials for this Owner
Home Financials are based on the most recent Mortgage that was taken out on this home.
Original Mortgage
$141,580
Interest Rate
8.27%
Mortgage Type
FHA
Create a Home Valuation Report for This Property
The Home Valuation Report is an in-depth analysis detailing your home's value as well as a comparison with similar homes in the area
Home Values in the Area
Average Home Value in this Area
Purchase History
| Date | Buyer | Sale Price | Title Company |
|---|---|---|---|
| Salmassian Vahab | -- | None Available | |
| Salmassian Vahab | $249,000 | First Centennial Title Co | |
| Lau Randy I | $143,000 | First American Title |
Source: Public Records
Mortgage History
| Date | Status | Borrower | Loan Amount |
|---|---|---|---|
| Open | Salmassian Vahab | $199,200 | |
| Previous Owner | Lau Randy I | $141,580 |
Source: Public Records
Tax History Compared to Growth
Tax History
| Year | Tax Paid | Tax Assessment Tax Assessment Total Assessment is a certain percentage of the fair market value that is determined by local assessors to be the total taxable value of land and additions on the property. | Land | Improvement |
|---|---|---|---|---|
| 2025 | $1,652 | $85,270 | $31,640 | $53,630 |
| 2024 | $1,652 | $81,617 | $27,545 | $54,072 |
| 2023 | $1,163 | $80,876 | $29,610 | $51,266 |
| 2022 | $1,559 | $68,532 | $25,760 | $42,772 |
| 2021 | $1,516 | $63,267 | $20,650 | $42,617 |
| 2020 | $1,469 | $62,292 | $19,530 | $42,762 |
| 2019 | $1,426 | $60,635 | $19,215 | $41,420 |
| 2018 | $1,386 | $54,700 | $14,105 | $40,595 |
| 2017 | $1,345 | $53,782 | $13,125 | $40,657 |
| 2016 | $1,309 | $51,759 | $11,165 | $40,594 |
| 2015 | $1,306 | $50,530 | $9,940 | $40,590 |
| 2014 | $1,270 | $41,342 | $8,190 | $33,152 |
| 2013 | -- | $35,014 | $6,090 | $28,924 |
Source: Public Records
Map
Nearby Homes
- 9770 Brightridge Dr
- 9597 Long River Dr
- 9493 Long River Dr
- 12120 Camel Rock Dr
- 9542 Angel Falls Dr
- 9599 Canyon Meadows Dr
- 12190 Rocky Mountain St
- 11502 Andes St
- 12100 Himalaya St
- 12123 Andes St
- 11019 Bornite Ct
- 11165 White Sage Dr
- 7621 Gentle Rain Rd Unit Lot 195
- 10005 Sagewood Dr
- 7812 Lazy Stream Dr Unit Lot 157
- 7824 Lazy Stream Dr Unit 154
- 7800 Lazy Stream Dr
- 7800 Lazy Stream Dr Unit Lot 160
- 7840 Lazy Stream Dr
- 7844 Lazy Stream Dr
- 9720 Stone Vista Ct
- 9740 Stone Vista Ct
- 9710 Stone Vista Ct
- 9715 Drybrush Ct
- 9725 Drybrush Ct
- 9750 Stone Vista Ct
- 9725 Stone Vista Ct
- 9735 Drybrush Ct
- 9700 Stone Vista Ct
- 9715 Stone Vista Ct
- 11805 Desert Bloom Dr
- 9745 Drybrush Ct
- 9760 Stone Vista Ct
- 9755 Stone Vista Ct
- 11875 Desert Bloom Dr
- 9765 Stone Vista Ct
- 9755 Drybrush Ct
- 11885 Desert Bloom Dr
- 9740 Drybrush Ct
- 9720 Silver Desert Way