Estimated Value: $375,838 - $422,000
4
Beds
3
Baths
2,283
Sq Ft
$173/Sq Ft
Est. Value
About This Home
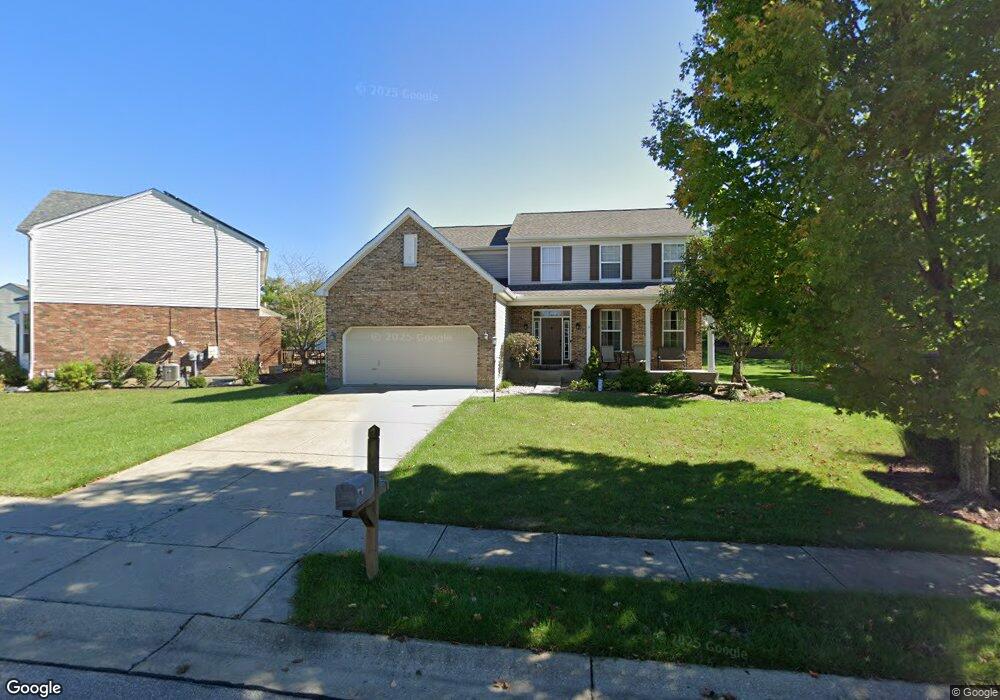
This home is located at 9734 Cherbourg Dr Unit L111, Union, KY 41091 and is currently estimated at $395,710, approximately $173 per square foot. 9734 Cherbourg Dr Unit L111 is a home located in Boone County with nearby schools including Erpenbeck Elementary School, Ockerman Middle School, and Larry A. Ryle High School.
Ownership History
Date
Name
Owned For
Owner Type
Purchase Details
Closed on
Jul 26, 2001
Sold by
Nance Thomas A
Bought by
Buerger Anthony R and Buerger Beth L
Current Estimated Value
Home Financials for this Owner
Home Financials are based on the most recent Mortgage that was taken out on this home.
Original Mortgage
$165,600
Outstanding Balance
$64,271
Interest Rate
7.08%
Mortgage Type
New Conventional
Estimated Equity
$331,439
Purchase Details
Closed on
Apr 16, 1999
Sold by
Ryland Group Inc
Bought by
Nance Thomas A and Nance Robin
Home Financials for this Owner
Home Financials are based on the most recent Mortgage that was taken out on this home.
Original Mortgage
$140,350
Interest Rate
7.08%
Mortgage Type
New Conventional
Purchase Details
Closed on
Sep 11, 1998
Sold by
A & K Enterprise Inc
Bought by
Ryland Group Inc
Create a Home Valuation Report for This Property
The Home Valuation Report is an in-depth analysis detailing your home's value as well as a comparison with similar homes in the area
Home Values in the Area
Average Home Value in this Area
Purchase History
| Date | Buyer | Sale Price | Title Company |
|---|---|---|---|
| Buerger Anthony R | $184,000 | -- | |
| Nance Thomas A | $165,150 | -- | |
| Ryland Group Inc | $25,950 | -- |
Source: Public Records
Mortgage History
| Date | Status | Borrower | Loan Amount |
|---|---|---|---|
| Open | Buerger Anthony R | $165,600 | |
| Previous Owner | Nance Thomas A | $140,350 |
Source: Public Records
Tax History Compared to Growth
Tax History
| Year | Tax Paid | Tax Assessment Tax Assessment Total Assessment is a certain percentage of the fair market value that is determined by local assessors to be the total taxable value of land and additions on the property. | Land | Improvement |
|---|---|---|---|---|
| 2024 | $2,588 | $228,800 | $30,000 | $198,800 |
| 2023 | $2,679 | $228,800 | $30,000 | $198,800 |
| 2022 | $2,569 | $228,800 | $30,000 | $198,800 |
| 2021 | $2,649 | $228,800 | $30,000 | $198,800 |
| 2020 | $2,619 | $228,800 | $30,000 | $198,800 |
| 2019 | $2,439 | $210,580 | $30,000 | $180,580 |
| 2018 | $2,478 | $210,580 | $30,000 | $180,580 |
| 2017 | $2,403 | $210,580 | $30,000 | $180,580 |
| 2015 | $2,373 | $210,580 | $30,000 | $180,580 |
| 2013 | -- | $211,820 | $30,000 | $181,820 |
Source: Public Records
Map
Nearby Homes
- 3832 Sonata Dr
- 9807 Cherbourg Dr
- 10077 Russwill Ln
- 8540 Concerto Ct
- 8558 Concerto Ct Unit 251C
- 8554 Concerto Ct Unit 251B
- 8550 Concerto Ct Unit 251A
- 8566 Concerto Ct
- 8554 Concerto Ct
- 8558 Concerto Ct
- 8570 Concerto Ct
- 8550 Concerto Ct
- 8520 Concerto Ct
- 8524 Concerto Ct
- 8536 Concerto Ct
- 8528 Concerto Ct
- DARDEN Plan at Harmony - Harmony Bluffs Condos
- CAYWOOD Plan at Harmony - Harmony Bluffs Condos
- ATWOOD Plan at Harmony - Harmony Bluffs Condos
- BRECK Plan at Harmony - Harmony Bluffs Condos
- 9734 Cherbourg Dr
- 9738 Cherbourg Dr
- 1169 Abbington Dr
- 1165 Abbington Dr
- 9737 Cherbourg Dr
- 9733 Cherbourg Dr
- 1161 Abbington Dr
- 1161 Abbington Dr Unit 87
- 9722 Cherbourg Dr
- 9743 Cherbourg Dr Unit L117
- 9729 Cherbourg Dr
- 3596 Evensong Dr
- 9746 Cherbourg Dr
- 3604 Evensong Dr
- 3600 Evensong Dr
- 3600 Evensong Dr Unit 70
- 1166 Abbington Dr
- 3612 Evensong Dr
- 3608 Evensong Dr
- 3608 Evensong Dr Unit 72