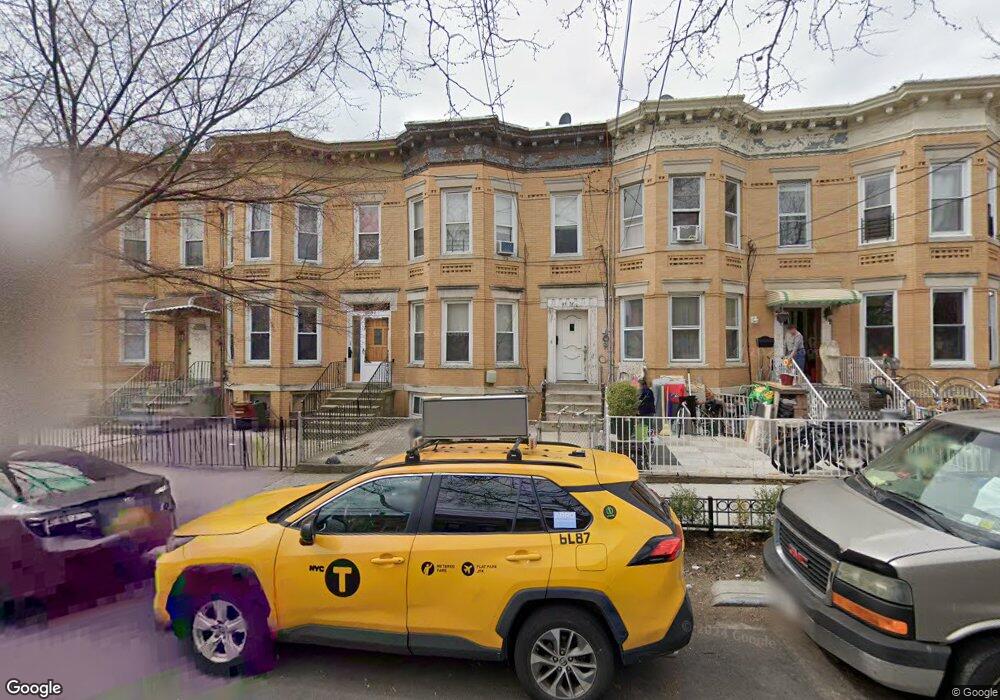
9736 76th St Ozone Park, NY 11416
Ozone Park NeighborhoodEstimated Value: $797,574 - $961,000
--
Bed
--
Bath
2,048
Sq Ft
$446/Sq Ft
Est. Value
About This Home
This home is located at 9736 76th St, Ozone Park, NY 11416 and is currently estimated at $912,894, approximately $445 per square foot. 9736 76th St is a home located in Queens County with nearby schools including P.S. 64 - Joseph P. Addabbo, Santiam Elementary School, and Jhs 210 Elizabeth Blackwell.
Ownership History
Date
Name
Owned For
Owner Type
Purchase Details
Closed on
Aug 26, 2013
Sold by
Rosendo Jose
Bought by
Rodriguez Cesar O
Current Estimated Value
Home Financials for this Owner
Home Financials are based on the most recent Mortgage that was taken out on this home.
Original Mortgage
$382,936
Outstanding Balance
$283,674
Interest Rate
4.37%
Mortgage Type
FHA
Estimated Equity
$629,220
Purchase Details
Closed on
Jun 22, 2007
Sold by
Garay Esteban Moran
Bought by
Rosendo Jose
Home Financials for this Owner
Home Financials are based on the most recent Mortgage that was taken out on this home.
Original Mortgage
$191,600
Interest Rate
6.39%
Create a Home Valuation Report for This Property
The Home Valuation Report is an in-depth analysis detailing your home's value as well as a comparison with similar homes in the area
Home Values in the Area
Average Home Value in this Area
Purchase History
| Date | Buyer | Sale Price | Title Company |
|---|---|---|---|
| Rodriguez Cesar O | $390,000 | -- | |
| Rodriguez Cesar O | $390,000 | -- | |
| Rosendo Jose | $638,600 | -- | |
| Rosendo Jose | $638,600 | -- |
Source: Public Records
Mortgage History
| Date | Status | Borrower | Loan Amount |
|---|---|---|---|
| Open | Rodriguez Cesar O | $382,936 | |
| Closed | Rodriguez Cesar O | $382,936 | |
| Previous Owner | Rosendo Jose | $191,600 | |
| Previous Owner | Rosendo Jose | $447,000 |
Source: Public Records
Tax History Compared to Growth
Tax History
| Year | Tax Paid | Tax Assessment Tax Assessment Total Assessment is a certain percentage of the fair market value that is determined by local assessors to be the total taxable value of land and additions on the property. | Land | Improvement |
|---|---|---|---|---|
| 2025 | $7,168 | $37,763 | $13,461 | $24,302 |
| 2024 | $7,168 | $35,686 | $12,522 | $23,164 |
| 2023 | $7,168 | $35,686 | $12,689 | $22,997 |
| 2022 | $6,781 | $45,360 | $17,580 | $27,780 |
| 2021 | $7,020 | $41,520 | $17,580 | $23,940 |
| 2020 | $6,661 | $42,600 | $17,580 | $25,020 |
| 2019 | $6,221 | $46,920 | $17,580 | $29,340 |
| 2018 | $6,062 | $29,738 | $13,963 | $15,775 |
| 2017 | $5,770 | $28,305 | $13,596 | $14,709 |
| 2016 | $5,557 | $28,305 | $13,596 | $14,709 |
| 2015 | $3,221 | $26,224 | $17,810 | $8,414 |
| 2014 | $3,221 | $24,782 | $17,525 | $7,257 |
Source: Public Records
Map
Nearby Homes