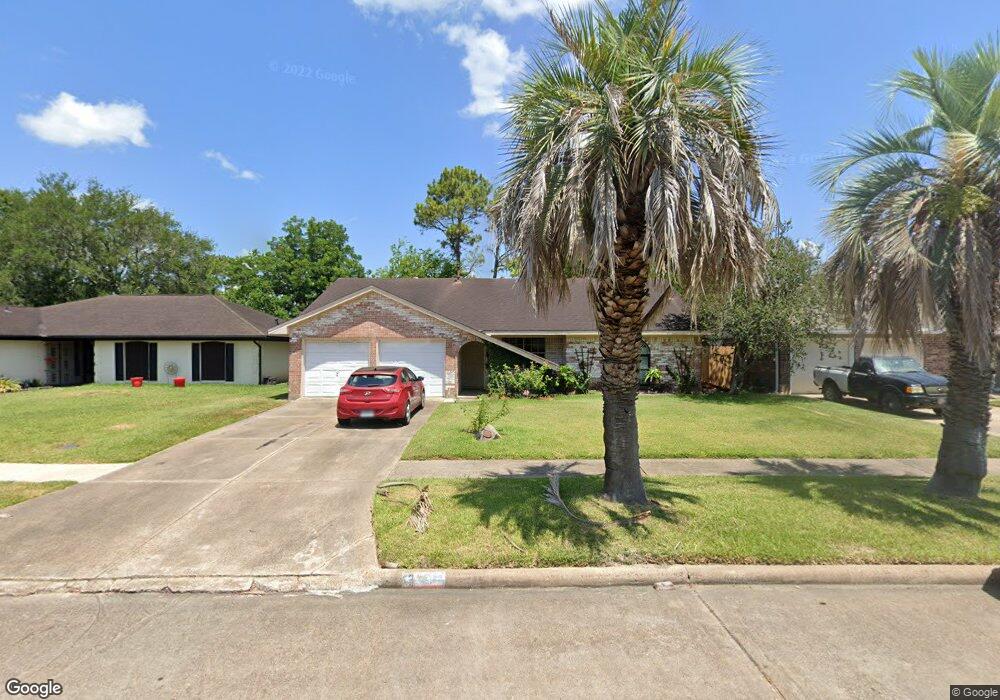
9739 Kirkville Dr Houston, TX 77089
Southbelt-Ellington NeighborhoodEstimated Value: $225,779 - $253,000
3
Beds
2
Baths
1,389
Sq Ft
$170/Sq Ft
Est. Value
About This Home
This home is located at 9739 Kirkville Dr, Houston, TX 77089 and is currently estimated at $236,695, approximately $170 per square foot. 9739 Kirkville Dr is a home located in Harris County with nearby schools including Atkinson Elementary School, Beverly Hill Intermediate School, and Morris Middle School.
Ownership History
Date
Name
Owned For
Owner Type
Purchase Details
Closed on
May 18, 2017
Sold by
Westfall Eril K and Westfall Jull E
Bought by
Weeden Iris and Peirson Chris
Current Estimated Value
Home Financials for this Owner
Home Financials are based on the most recent Mortgage that was taken out on this home.
Original Mortgage
$150,719
Outstanding Balance
$124,236
Interest Rate
3.87%
Mortgage Type
FHA
Estimated Equity
$112,459
Purchase Details
Closed on
Mar 31, 2006
Sold by
Cooper Roger
Bought by
Westfall Erik K
Home Financials for this Owner
Home Financials are based on the most recent Mortgage that was taken out on this home.
Original Mortgage
$85,520
Interest Rate
6.21%
Mortgage Type
Purchase Money Mortgage
Purchase Details
Closed on
Aug 22, 2005
Sold by
Mullikin Curtis Grant
Bought by
Cooper Roger
Purchase Details
Closed on
Mar 25, 1998
Sold by
Warneke Angelle B and Mullikin Vanita
Bought by
Mullikin Curtis Grant
Create a Home Valuation Report for This Property
The Home Valuation Report is an in-depth analysis detailing your home's value as well as a comparison with similar homes in the area
Home Values in the Area
Average Home Value in this Area
Purchase History
| Date | Buyer | Sale Price | Title Company |
|---|---|---|---|
| Weeden Iris | -- | None Available | |
| Westfall Erik K | -- | Chicago Title | |
| Cooper Roger | -- | Chicago Title Insurance Co | |
| Mullikin Curtis Grant | -- | -- |
Source: Public Records
Mortgage History
| Date | Status | Borrower | Loan Amount |
|---|---|---|---|
| Open | Weeden Iris | $150,719 | |
| Previous Owner | Westfall Erik K | $85,520 |
Source: Public Records
Tax History Compared to Growth
Tax History
| Year | Tax Paid | Tax Assessment Tax Assessment Total Assessment is a certain percentage of the fair market value that is determined by local assessors to be the total taxable value of land and additions on the property. | Land | Improvement |
|---|---|---|---|---|
| 2025 | $3,000 | $197,965 | $40,812 | $157,153 |
| 2024 | $3,000 | $196,333 | $40,812 | $155,521 |
| 2023 | $3,000 | $196,333 | $40,812 | $155,521 |
| 2022 | $4,379 | $188,801 | $40,812 | $147,989 |
| 2021 | $4,178 | $155,519 | $40,812 | $114,707 |
| 2020 | $4,216 | $153,785 | $40,812 | $112,973 |
| 2019 | $4,061 | $150,483 | $34,010 | $116,473 |
| 2018 | $1,474 | $128,068 | $26,188 | $101,880 |
| 2017 | $3,398 | $128,068 | $26,188 | $101,880 |
| 2016 | $3,089 | $124,940 | $26,188 | $98,752 |
| 2015 | $2,026 | $108,061 | $23,807 | $84,254 |
| 2014 | $2,026 | $100,637 | $20,406 | $80,231 |
Source: Public Records
Map
Nearby Homes
- 11311 Caribbean Ln
- 9743 Santa Monica Blvd
- 11414 Kirkwyn Dr
- 11303 Caribbean Ln
- 10906 Keese Dr
- 9711 Ebb St
- 10815 Ritow St
- 10519 Sagepark Ln
- 10406 Sagestar Ln
- 10410 Sagestar Ln
- 10411 Sagewillow Ln
- 10415 Sagewillow Ln
- 10810 Kirkbend Dr
- 11107 Kirkpark Dr
- 10207 Rambling Trail
- 10214 Buena Park Dr
- 10702 Sagewillow Ln
- 11930 Kirkway Dr
- 10507 Kirkhill Dr
- 10619 Wheaton Dr
- 9743 Kirkville Dr
- 9735 Kirkville Dr
- 9742 Kirkfalls Dr
- 9747 Kirkville Dr
- 9738 Kirkfalls Dr
- 9731 Kirkville Dr
- 9746 Kirkfalls Dr
- 11403 Kirkhollow Dr
- 9734 Kirkfalls Dr
- 9727 Kirkville Dr
- 11426 Kirkmeadow Dr
- 11402 Kirkhollow Dr
- 9730 Kirkfalls Dr
- 11407 Kirkhollow Dr
- 9723 Kirkville Dr
- 11419 Kirkmeadow Dr
- 11406 Kirkhollow Dr
- 9726 Kirkfalls Dr
- 11423 Kirkmeadow Dr
- 11415 Kirkmeadow Dr