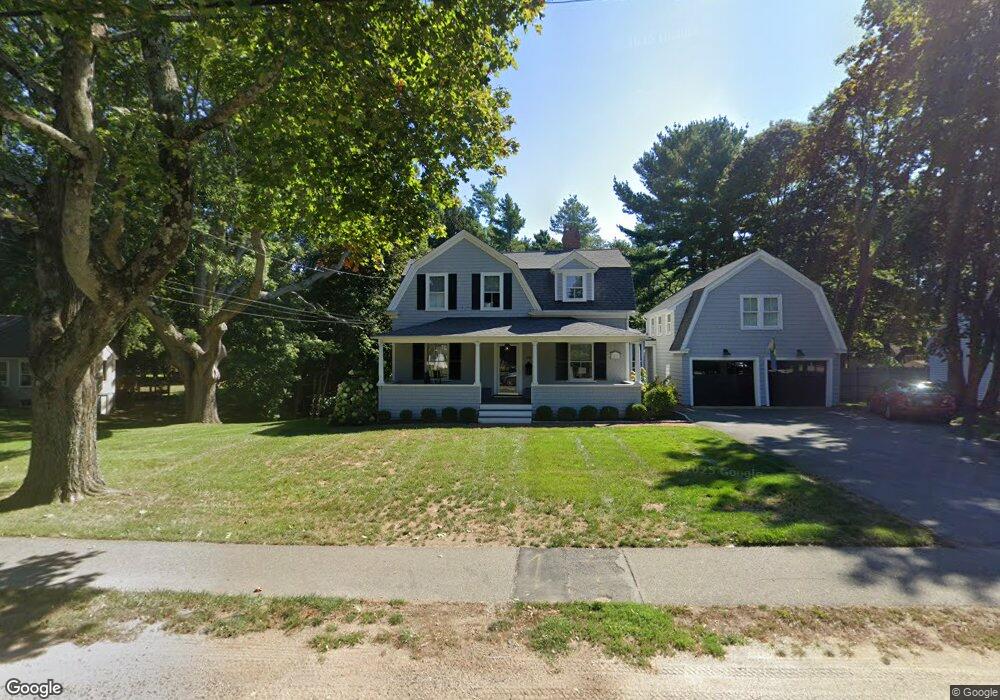
974 Main St Hingham, MA 02043
South Hingham NeighborhoodEstimated Value: $1,480,000 - $2,259,000
5
Beds
3
Baths
2,654
Sq Ft
$673/Sq Ft
Est. Value
About This Home
This home is located at 974 Main St, Hingham, MA 02043 and is currently estimated at $1,786,383, approximately $673 per square foot. 974 Main St is a home located in Plymouth County with nearby schools including South Elementary School, Norwell KinderCare, and Fusion Academy Hingham.
Ownership History
Date
Name
Owned For
Owner Type
Purchase Details
Closed on
Jul 25, 2019
Sold by
Sartori Jeremy W and Voss Alexis H
Bought by
Voss Alexis H
Current Estimated Value
Purchase Details
Closed on
Dec 27, 2011
Sold by
Taylor Jeffrey S and Taylor Shannon D
Bought by
Sartori Jeremy W and Sartori Alexis V
Home Financials for this Owner
Home Financials are based on the most recent Mortgage that was taken out on this home.
Original Mortgage
$182,500
Interest Rate
4%
Mortgage Type
Purchase Money Mortgage
Purchase Details
Closed on
Jan 7, 2003
Sold by
Alcarez Laurence P and Alcarez Barbara G
Bought by
Taylor Jeffrey S and Taylor Shannon D
Create a Home Valuation Report for This Property
The Home Valuation Report is an in-depth analysis detailing your home's value as well as a comparison with similar homes in the area
Home Values in the Area
Average Home Value in this Area
Purchase History
| Date | Buyer | Sale Price | Title Company |
|---|---|---|---|
| Voss Alexis H | $181,405 | -- | |
| Voss Alexis H | $181,405 | -- | |
| Sartori Jeremy W | $782,500 | -- | |
| Sartori Jeremy W | $782,500 | -- | |
| Sartori Jeremy W | $782,500 | -- | |
| Taylor Jeffrey S | $695,000 | -- | |
| Taylor Jeffrey S | $695,000 | -- |
Source: Public Records
Mortgage History
| Date | Status | Borrower | Loan Amount |
|---|---|---|---|
| Previous Owner | Sartori Jeremy W | $182,500 |
Source: Public Records
Tax History Compared to Growth
Tax History
| Year | Tax Paid | Tax Assessment Tax Assessment Total Assessment is a certain percentage of the fair market value that is determined by local assessors to be the total taxable value of land and additions on the property. | Land | Improvement |
|---|---|---|---|---|
| 2025 | $16,092 | $1,505,300 | $537,100 | $968,200 |
| 2024 | $16,004 | $1,475,000 | $537,100 | $937,900 |
| 2023 | $14,451 | $1,445,100 | $537,100 | $908,000 |
| 2022 | $13,732 | $1,187,900 | $445,800 | $742,100 |
| 2021 | $13,670 | $1,158,500 | $445,800 | $712,700 |
| 2020 | $13,358 | $1,158,500 | $445,800 | $712,700 |
| 2019 | $13,533 | $1,145,900 | $445,800 | $700,100 |
| 2018 | $10,655 | $905,300 | $445,800 | $459,500 |
| 2017 | $10,191 | $831,900 | $445,000 | $386,900 |
| 2016 | $10,126 | $810,700 | $423,800 | $386,900 |
| 2015 | $9,902 | $790,300 | $403,400 | $386,900 |
Source: Public Records
Map
Nearby Homes
- 12 Hoover Rd
- 1088 Main St
- 4 Richard Rd
- 1 Kerri Ln
- 3 Patriots Way
- 212 Cushing St
- 100 Whiting St
- 18 Whiting Ln
- 3 Howland Ln
- 2 Black Rock Dr Unit 21
- 2 Black Rock Dr
- 32-70 Lazell St
- 639 Main St
- 214 Washington St Unit 24
- 214 Washington St Unit 28
- 70 Lazell St
- 251 Prospect St
- 135 Free St
- 32 Lazell St
- 86 Black Rock Dr