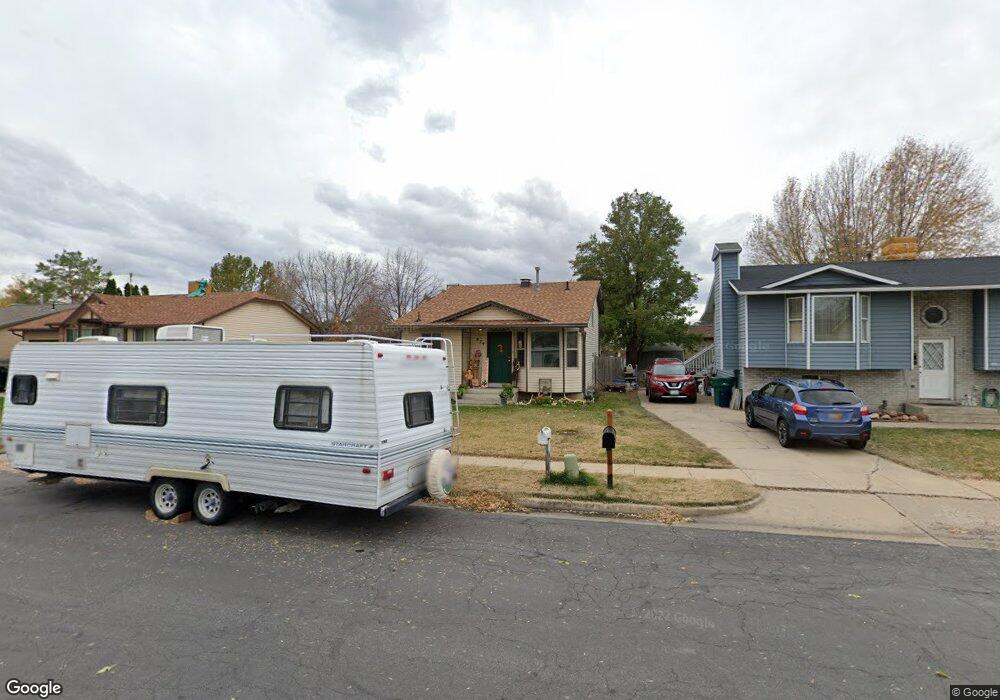
974 S 225 E Layton, UT 84041
Estimated Value: $374,000 - $411,000
3
Beds
1
Bath
1,181
Sq Ft
$329/Sq Ft
Est. Value
About This Home
This home is located at 974 S 225 E, Layton, UT 84041 and is currently estimated at $388,955, approximately $329 per square foot. 974 S 225 E is a home located in Davis County with nearby schools including Layton Elementary School, Fairfield Junior High School, and Davis High School.
Ownership History
Date
Name
Owned For
Owner Type
Purchase Details
Closed on
Mar 1, 2021
Sold by
Wall Dillon J and Wall Braylee I
Bought by
Wall Dillon J and Wall Braylee
Current Estimated Value
Home Financials for this Owner
Home Financials are based on the most recent Mortgage that was taken out on this home.
Original Mortgage
$179,600
Outstanding Balance
$160,632
Interest Rate
2.7%
Mortgage Type
New Conventional
Estimated Equity
$228,323
Purchase Details
Closed on
Jul 31, 2017
Sold by
Gillman Alan Reed and Gillman Lori D
Bought by
Wall Dillon and Wall Braylee I
Home Financials for this Owner
Home Financials are based on the most recent Mortgage that was taken out on this home.
Original Mortgage
$181,649
Interest Rate
4.5%
Mortgage Type
FHA
Purchase Details
Closed on
Nov 6, 1998
Sold by
Black Lyle H and Black Deeann
Bought by
Gillman Alan Reed and Gillman Lori D
Home Financials for this Owner
Home Financials are based on the most recent Mortgage that was taken out on this home.
Original Mortgage
$103,632
Interest Rate
6.42%
Mortgage Type
FHA
Create a Home Valuation Report for This Property
The Home Valuation Report is an in-depth analysis detailing your home's value as well as a comparison with similar homes in the area
Home Values in the Area
Average Home Value in this Area
Purchase History
| Date | Buyer | Sale Price | Title Company |
|---|---|---|---|
| Wall Dillon J | -- | Metro National Title Asso | |
| Wall Dillon | -- | -- | |
| Gillman Alan Reed | -- | Equity Title Agency |
Source: Public Records
Mortgage History
| Date | Status | Borrower | Loan Amount |
|---|---|---|---|
| Open | Wall Dillon J | $179,600 | |
| Closed | Wall Dillon | $181,649 | |
| Previous Owner | Gillman Alan Reed | $103,632 |
Source: Public Records
Tax History
| Year | Tax Paid | Tax Assessment Tax Assessment Total Assessment is a certain percentage of the fair market value that is determined by local assessors to be the total taxable value of land and additions on the property. | Land | Improvement |
|---|---|---|---|---|
| 2025 | $1,729 | $181,500 | $87,817 | $93,683 |
| 2024 | $1,701 | $179,850 | $101,492 | $78,358 |
| 2023 | $1,610 | $300,000 | $91,911 | $208,089 |
| 2022 | $1,717 | $173,800 | $63,244 | $110,556 |
| 2021 | $1,537 | $232,000 | $94,935 | $137,065 |
| 2020 | $1,374 | $199,000 | $78,197 | $120,803 |
| 2019 | $1,333 | $189,000 | $84,703 | $104,297 |
| 2018 | $1,187 | $169,000 | $73,781 | $95,219 |
| 2016 | $1,026 | $75,350 | $26,759 | $48,591 |
| 2015 | $973 | $67,870 | $26,759 | $41,111 |
| 2014 | $994 | $70,884 | $26,759 | $44,125 |
| 2013 | -- | $62,989 | $11,447 | $51,542 |
Source: Public Records
Map
Nearby Homes
- 949 S 225 E
- 948 S 250 E
- 282 E 925 S
- 799 S 125 E
- 80 E 850 S
- 753 S 300 E
- 389 Morgan St
- 706 S 600 E
- 811 S Main St
- 623 E Clearwater Dr Unit 15
- 617 E 405 S
- 905 S Main St Unit G
- 895 S Main St Unit E
- 917 S Main St Unit H
- 189 S Main St Unit 76
- 189 S Main St Unit 21
- 679 S Clearwater Falls Dr
- 680 N Main St Trlr E-11
- 680 N Main St Unit B13
- 680 N Main St Unit D14
Your Personal Tour Guide
Ask me questions while you tour the home.