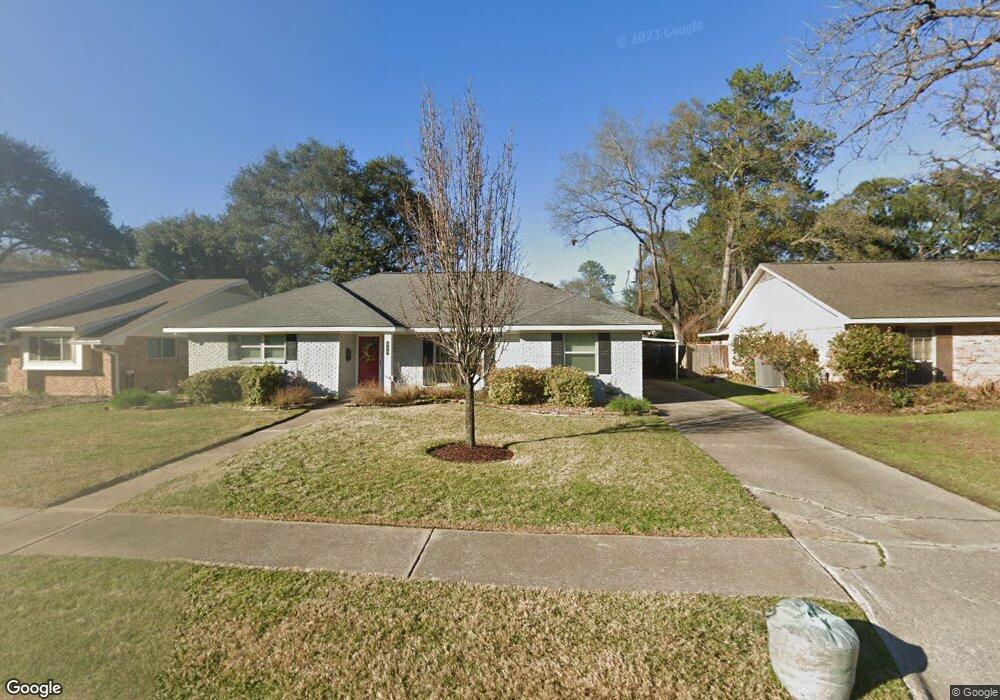
974 Thornton Rd Houston, TX 77018
Oak Forest-Garden Oaks NeighborhoodEstimated Value: $510,000 - $773,000
3
Beds
2
Baths
1,902
Sq Ft
$351/Sq Ft
Est. Value
About This Home
This home is located at 974 Thornton Rd, Houston, TX 77018 and is currently estimated at $668,513, approximately $351 per square foot. 974 Thornton Rd is a home located in Harris County with nearby schools including Durham Elementary School, Frank Black Middle School, and Waltrip High School.
Ownership History
Date
Name
Owned For
Owner Type
Purchase Details
Closed on
Feb 22, 2011
Sold by
Lestelle Anne and Lestelle Thomas
Bought by
Termina Joseph J and Ponville Termina Amy E
Current Estimated Value
Home Financials for this Owner
Home Financials are based on the most recent Mortgage that was taken out on this home.
Original Mortgage
$273,760
Outstanding Balance
$193,601
Interest Rate
5.5%
Mortgage Type
FHA
Estimated Equity
$474,912
Purchase Details
Closed on
Mar 24, 2006
Sold by
Gremillion Lance Wayne and Gremillion Elmarine Lydia
Bought by
Lestelle Thomas and Lestelle Anne
Home Financials for this Owner
Home Financials are based on the most recent Mortgage that was taken out on this home.
Original Mortgage
$150,400
Interest Rate
6.21%
Mortgage Type
Fannie Mae Freddie Mac
Create a Home Valuation Report for This Property
The Home Valuation Report is an in-depth analysis detailing your home's value as well as a comparison with similar homes in the area
Home Values in the Area
Average Home Value in this Area
Purchase History
| Date | Buyer | Sale Price | Title Company |
|---|---|---|---|
| Termina Joseph J | -- | Capital Title Of Texas Llc | |
| Lestelle Thomas | -- | Stewart Title Company |
Source: Public Records
Mortgage History
| Date | Status | Borrower | Loan Amount |
|---|---|---|---|
| Open | Termina Joseph J | $273,760 | |
| Previous Owner | Lestelle Thomas | $150,400 |
Source: Public Records
Tax History
| Year | Tax Paid | Tax Assessment Tax Assessment Total Assessment is a certain percentage of the fair market value that is determined by local assessors to be the total taxable value of land and additions on the property. | Land | Improvement |
|---|---|---|---|---|
| 2025 | $11,208 | $728,579 | $329,000 | $399,579 |
| 2024 | $11,208 | $720,209 | $329,000 | $391,209 |
| 2023 | $11,208 | $665,868 | $296,100 | $369,768 |
| 2022 | $13,406 | $608,831 | $296,100 | $312,731 |
| 2021 | $13,140 | $563,798 | $296,100 | $267,698 |
| 2020 | $12,802 | $528,658 | $246,750 | $281,908 |
| 2019 | $12,414 | $490,588 | $246,750 | $243,838 |
| 2018 | $9,071 | $460,705 | $246,750 | $213,955 |
| 2017 | $11,509 | $485,812 | $246,750 | $239,062 |
| 2016 | $10,462 | $485,812 | $246,750 | $239,062 |
| 2015 | $6,889 | $441,824 | $246,750 | $195,074 |
| 2014 | $6,889 | $392,648 | $205,625 | $187,023 |
Source: Public Records
Map
Nearby Homes
- 826 Curtin St Unit G
- 826 Curtin St Unit F
- 830 Azalea St
- 817 Thornton Rd Unit G
- 817 Thornton Rd Unit F
- 808 Woodcrest Dr Unit B
- 808 Woodcrest Dr Unit A
- 4904 Brinkman St
- 812 Thornton Rd Unit D
- 814 Azalea St
- 1018 Candlelight Ln
- 934 W 43rd St
- 1043 Martin St
- 811 Thornton Rd Unit C
- 811 Thornton Rd Unit D
- 807 Martin St Unit C
- 754 Curtin St
- 756 Curtin St
- 810 Martin St
- 803 Martin St Unit C
- 970 Thornton Rd
- 978 Thornton Rd
- 935 Chantilly Ln
- 966 Thornton Rd
- 939 Chantilly Ln
- 927 Chantilly Ln
- 975 Thornton Rd
- 971 Thornton Rd
- 979 Thornton Rd
- 962 Thornton Rd
- 923 Chantilly Ln
- 4615 Dunsmere St
- 4619 Dunsmere St
- 963 Thornton Rd
- 4607 Dunsmere St
- 4603 Dunsmere St
- 958 Thornton Rd
- 934 Chantilly Ln
- 978 Curtin St
- 972 Curtin St
Your Personal Tour Guide
Ask me questions while you tour the home.