Estimated Value: $260,955 - $311,000
--
Bed
--
Bath
1,500
Sq Ft
$188/Sq Ft
Est. Value
About This Home
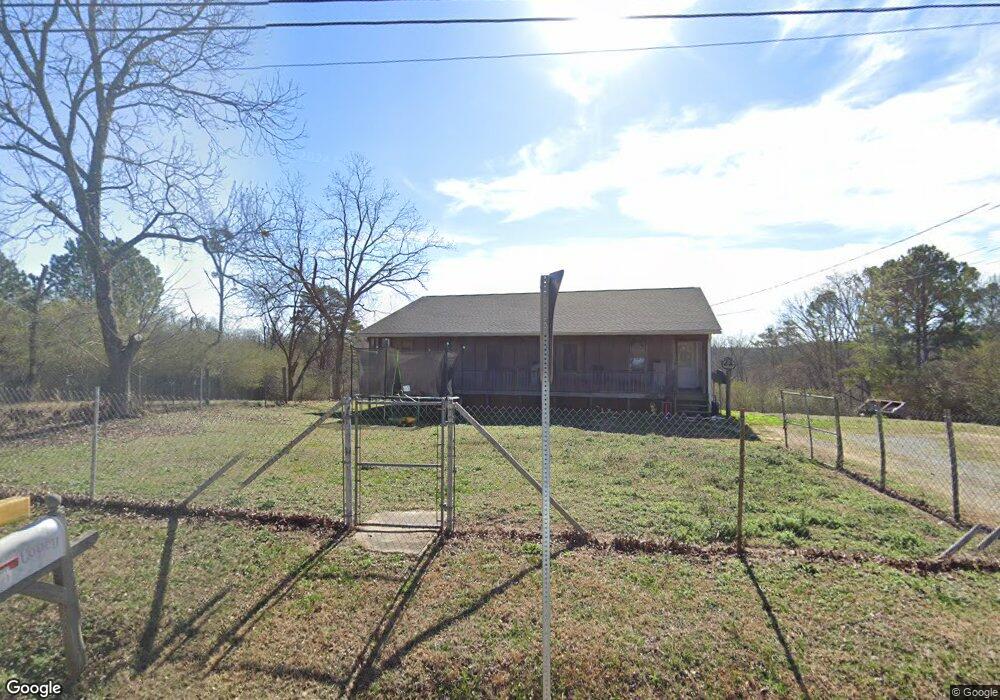
This home is located at 974 Wayside Rd NE, Rome, GA 30161 and is currently estimated at $281,989, approximately $187 per square foot. 974 Wayside Rd NE is a home located in Floyd County with nearby schools including Model Middle School, Model High School, and Unity Christian School.
Ownership History
Date
Name
Owned For
Owner Type
Purchase Details
Closed on
Jul 17, 2024
Sold by
Wilkerson Ronnie
Bought by
Wilkerson Jenny
Current Estimated Value
Purchase Details
Closed on
Sep 21, 2015
Sold by
Newmarker Rita
Bought by
Wilkerson Ronnie and Wilerson Jenny
Purchase Details
Closed on
Sep 17, 2015
Sold by
Stansell Nancy
Bought by
Wilkerson Ronnie and Wilkerson Jenny
Purchase Details
Closed on
Sep 16, 2015
Sold by
Waters Tony Franklin
Bought by
Wilkerson Ronnie and Wilkerson Jenny
Purchase Details
Closed on
Dec 5, 1988
Sold by
Stansell Nancy J
Bought by
Annie Waters M and Annie Muriel
Purchase Details
Closed on
Nov 12, 1987
Sold by
Annie Waters M and Annie Muriel
Bought by
Stansell Nancy J
Purchase Details
Closed on
May 24, 1973
Bought by
P and R
Purchase Details
Closed on
Apr 11, 1967
Sold by
Teague Mamie B Mrs
Bought by
Teague Harry and M D
Purchase Details
Closed on
Jan 1, 1951
Sold by
Teague Chester Arthur
Bought by
Teague Mamie B Mrs
Purchase Details
Closed on
Jan 1, 1901
Bought by
Teague Chester Arthur
Create a Home Valuation Report for This Property
The Home Valuation Report is an in-depth analysis detailing your home's value as well as a comparison with similar homes in the area
Home Values in the Area
Average Home Value in this Area
Purchase History
| Date | Buyer | Sale Price | Title Company |
|---|---|---|---|
| Wilkerson Jenny | -- | -- | |
| Wilkerson Ronnie | -- | -- | |
| Wilkerson Ronnie | -- | -- | |
| Wilkerson Ronnie | -- | -- | |
| Annie Waters M | -- | -- | |
| Stansell Nancy J | -- | -- | |
| P | -- | -- | |
| Annie Waters M | -- | -- | |
| Teague Harry | -- | -- | |
| Teague Mamie B Mrs | -- | -- | |
| Teague Chester Arthur | -- | -- |
Source: Public Records
Tax History Compared to Growth
Tax History
| Year | Tax Paid | Tax Assessment Tax Assessment Total Assessment is a certain percentage of the fair market value that is determined by local assessors to be the total taxable value of land and additions on the property. | Land | Improvement |
|---|---|---|---|---|
| 2024 | $3,513 | $120,788 | $11,510 | $109,278 |
| 2023 | $2,090 | $72,892 | $10,464 | $62,428 |
| 2022 | $1,791 | $60,356 | $8,633 | $51,723 |
| 2021 | $1,640 | $54,336 | $7,858 | $46,478 |
| 2020 | $1,569 | $51,556 | $6,832 | $44,724 |
| 2019 | $1,493 | $49,717 | $6,832 | $42,885 |
| 2018 | $1,430 | $47,532 | $6,508 | $41,024 |
| 2017 | $1,388 | $46,050 | $6,026 | $40,024 |
| 2016 | $1,371 | $44,932 | $6,000 | $38,932 |
| 2015 | -- | $44,932 | $6,000 | $38,932 |
| 2014 | -- | $44,932 | $6,000 | $38,932 |
Source: Public Records
Map
Nearby Homes
- 84 Harris Rd NE
- 637 Wayside Rd NE
- 608 Wayside Rd NE
- 1644 Wayside Rd NE
- 424 Wayside Rd NE
- 32 Fieldstone Dr NE
- 107 Whispering Pines NE
- 105 Whispering Pines NE
- 5 Larkwood Dr NE
- 3 NE Page Dr
- 492 Moran Lake Rd NE
- 24 Woodcliffe Dr NE
- 197 Wayside Rd NE
- 1799 Wayside Rd
- 16 Maycroft Ct
- 13 Maycroft Ct
- 29 Woodcliffe Dr NE
- 0 Calhoun Rd NE Unit 7516251
- 0 Calhoun Rd NE Unit 10488821
- 990 Wayside Rd NE
- 960 Wayside Rd NE
- 987 Wayside Rd NE
- 997 Wayside Rd NE
- 1001 Wayside Rd NE
- 928 Wayside Rd NE
- 1020 Wayside Rd NE
- 948 Wayside Rd NE
- 913 Wayside Rd NE
- 913 Wayside Rd NE
- 32 Sunny Heights Dr NE
- 904 Wayside Rd NE
- 36 Sunny Heights Dr NE
- 897 Wayside Rd NE
- 901 Wayside Rd NE
- 901 Wayside Rd NE
- 905 Wayside Rd NE
- 905 Wayside Rd NE
- 1045 Wayside Rd NE
- 1058 Wayside Rd NE