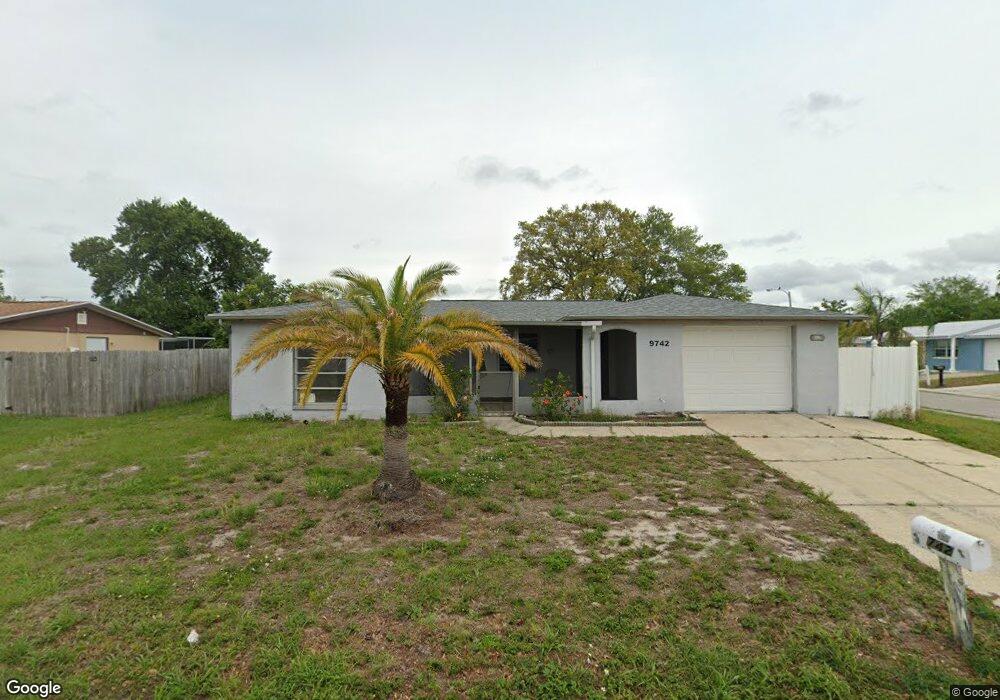
9742 Lake Chrise Ln Port Richey, FL 34668
Estimated Value: $226,000 - $261,000
2
Beds
2
Baths
1,442
Sq Ft
$168/Sq Ft
Est. Value
About This Home
This home is located at 9742 Lake Chrise Ln, Port Richey, FL 34668 and is currently estimated at $242,084, approximately $167 per square foot. 9742 Lake Chrise Ln is a home located in Pasco County with nearby schools including Fox Hollow Elementary School, Bayonet Point Middle School, and Fivay High School.
Ownership History
Date
Name
Owned For
Owner Type
Purchase Details
Closed on
May 6, 2011
Sold by
Wimberly John
Bought by
Patel Dineshbhai K and Patel Kailasben D
Current Estimated Value
Purchase Details
Closed on
Apr 18, 2011
Sold by
Buchs James R and Buchs Yvonne L
Bought by
Wimberly John
Purchase Details
Closed on
Mar 8, 2006
Sold by
Sharpe John J
Bought by
Buchs James R and Buchs Yvonne L
Home Financials for this Owner
Home Financials are based on the most recent Mortgage that was taken out on this home.
Original Mortgage
$131,400
Interest Rate
9.12%
Mortgage Type
Fannie Mae Freddie Mac
Purchase Details
Closed on
Nov 7, 2001
Sold by
Lennie William T
Bought by
Sharpe John J
Home Financials for this Owner
Home Financials are based on the most recent Mortgage that was taken out on this home.
Original Mortgage
$64,500
Interest Rate
6.67%
Mortgage Type
New Conventional
Create a Home Valuation Report for This Property
The Home Valuation Report is an in-depth analysis detailing your home's value as well as a comparison with similar homes in the area
Home Values in the Area
Average Home Value in this Area
Purchase History
| Date | Buyer | Sale Price | Title Company |
|---|---|---|---|
| Patel Dineshbhai K | $26,000 | Whitworth Title Group Inc | |
| Wimberly John | $17,100 | None Available | |
| Buchs James R | $146,000 | Galaxy Title Agency Llc | |
| Sharpe John J | $64,500 | -- |
Source: Public Records
Mortgage History
| Date | Status | Borrower | Loan Amount |
|---|---|---|---|
| Previous Owner | Buchs James R | $131,400 | |
| Previous Owner | Sharpe John J | $64,500 |
Source: Public Records
Tax History Compared to Growth
Tax History
| Year | Tax Paid | Tax Assessment Tax Assessment Total Assessment is a certain percentage of the fair market value that is determined by local assessors to be the total taxable value of land and additions on the property. | Land | Improvement |
|---|---|---|---|---|
| 2025 | $2,936 | $203,883 | $33,460 | $170,423 |
| 2024 | $2,936 | $219,208 | $33,460 | $185,748 |
| 2023 | $2,756 | $112,290 | $0 | $0 |
| 2022 | $2,162 | $163,313 | $22,383 | $140,930 |
| 2021 | $1,888 | $125,957 | $20,059 | $105,898 |
| 2020 | $1,726 | $113,280 | $10,055 | $103,225 |
| 2019 | $1,636 | $108,908 | $10,055 | $98,853 |
| 2018 | $1,454 | $90,351 | $10,055 | $80,296 |
| 2017 | $1,290 | $70,737 | $10,055 | $60,682 |
| 2016 | $1,147 | $61,702 | $9,796 | $51,906 |
| 2015 | $1,058 | $53,482 | $9,796 | $43,686 |
| 2014 | $945 | $47,636 | $8,487 | $39,149 |
Source: Public Records
Map
Nearby Homes
- 9825 Aetna Ln
- 7740 Sagebrush Dr
- 9836 Lakeside Ln
- 9633 Lakeside Ln
- 9825 Lakeside Ln
- 9915 Aetna Ln
- 7534 Culberson Dr
- 7835 Bloomfield Dr
- 9716 Glen Moor Ln
- 7510 Milbank Dr
- 9830 Mark Twain Ln
- 7811 Fox Hollow Dr
- 7511 Fox Hollow Dr
- 7831 Fox Hollow Dr
- 9826 Rainbow Ln
- 9720 Gray Fox Ln
- 7335 Castanea Dr
- 7334 Brentwood Dr
- 7340 Westcott Dr
- 7405 Oakshire Dr
- 9746 Lake Chrise Ln
- 9805 Wayside Ln
- 9740 Wayside Ln Unit 7
- 9800 Lake Chrise Ln
- 9810 Bishop Ln
- 9811 Wayside Ln Unit 7
- 9800 Wayside Ln
- 9737 Lake Chrise Ln
- 9741 Lake Chrise Ln
- 9825 Bishop Ln
- 9806 Wayside Ln
- 9745 Lake Chrise Ln
- 9733 Lake Chrise Ln
- 9816 Bishop Ln Unit 6
- 9810 Wayside Ln
- 9749 Lake Chrise Ln
- 9729 Lake Chrise Ln Unit 6A
- 9731 Sandstone Ln
- 9735 Sandstone Ln
- 9724 Lakeside Ln