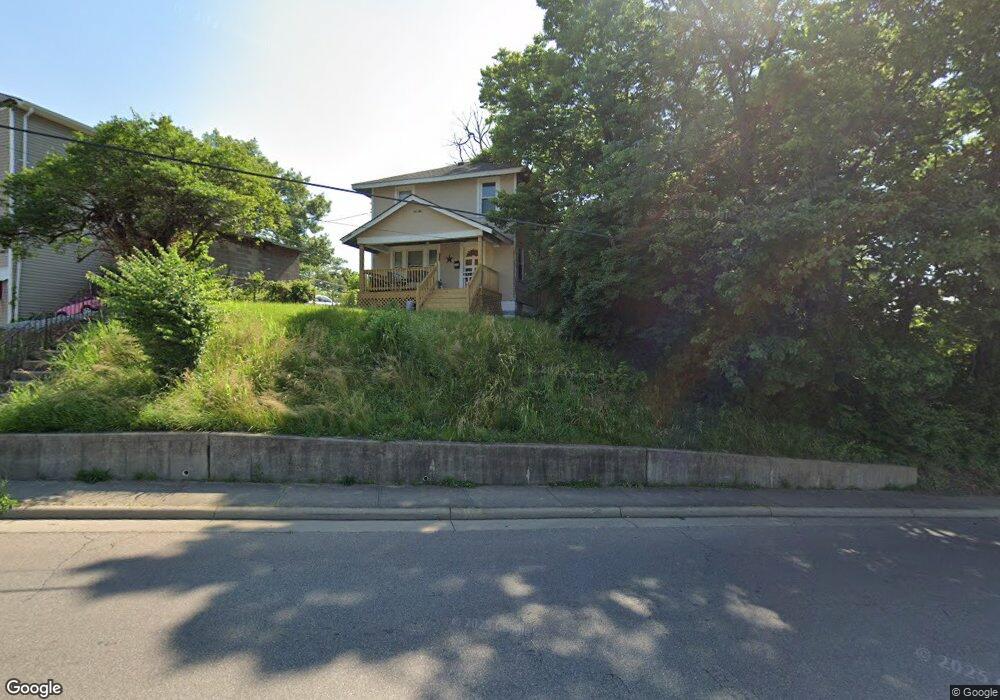
9748 Wayne Ave Cincinnati, OH 45215
Estimated Value: $72,000 - $108,928
2
Beds
2
Baths
968
Sq Ft
$87/Sq Ft
Est. Value
About This Home
This home is located at 9748 Wayne Ave, Cincinnati, OH 45215 and is currently estimated at $84,482, approximately $87 per square foot. 9748 Wayne Ave is a home located in Hamilton County with nearby schools including Lincoln Heights Elementary School, Princeton Community Middle School, and Princeton High School.
Ownership History
Date
Name
Owned For
Owner Type
Purchase Details
Closed on
Sep 28, 2017
Sold by
Chopra Deborah and Chopra D
Bought by
Roseman Marietta
Current Estimated Value
Purchase Details
Closed on
Oct 30, 2009
Sold by
Chopra Deborah
Bought by
Chopra Deborah and Cook Amogene
Purchase Details
Closed on
Aug 31, 2006
Sold by
Chopra Deborah and Cook Amogene
Bought by
Chopra Deborah
Home Financials for this Owner
Home Financials are based on the most recent Mortgage that was taken out on this home.
Original Mortgage
$66,000
Interest Rate
6.77%
Mortgage Type
New Conventional
Purchase Details
Closed on
Feb 23, 2006
Sold by
Roseman Marietta
Bought by
Chopra Deborah and Cook Amogene
Home Financials for this Owner
Home Financials are based on the most recent Mortgage that was taken out on this home.
Original Mortgage
$58,190
Interest Rate
11.75%
Mortgage Type
Fannie Mae Freddie Mac
Purchase Details
Closed on
Jun 12, 1995
Sold by
Lamb Melvin
Bought by
Lamb Melvin and Roseman Marietta
Create a Home Valuation Report for This Property
The Home Valuation Report is an in-depth analysis detailing your home's value as well as a comparison with similar homes in the area
Home Values in the Area
Average Home Value in this Area
Purchase History
| Date | Buyer | Sale Price | Title Company |
|---|---|---|---|
| Roseman Marietta | $35,090 | None Available | |
| Chopra Deborah | -- | Attorney | |
| Chopra Deborah | -- | None Available | |
| Chopra Deborah | $59,000 | None Available | |
| Lamb Melvin | -- | -- |
Source: Public Records
Mortgage History
| Date | Status | Borrower | Loan Amount |
|---|---|---|---|
| Previous Owner | Chopra Deborah | $66,000 | |
| Previous Owner | Chopra Deborah | $58,190 |
Source: Public Records
Tax History
| Year | Tax Paid | Tax Assessment Tax Assessment Total Assessment is a certain percentage of the fair market value that is determined by local assessors to be the total taxable value of land and additions on the property. | Land | Improvement |
|---|---|---|---|---|
| 2025 | $1,142 | $14,144 | $1,505 | $12,639 |
| 2024 | $975 | $14,144 | $1,505 | $12,639 |
| 2023 | $987 | $14,144 | $1,505 | $12,639 |
| 2022 | $500 | $4,771 | $1,505 | $3,266 |
| 2021 | $498 | $4,771 | $1,505 | $3,266 |
| 2020 | $494 | $4,771 | $1,505 | $3,266 |
| 2019 | $521 | $4,771 | $1,505 | $3,266 |
| 2018 | $505 | $4,771 | $1,505 | $3,266 |
| 2017 | $470 | $4,771 | $1,505 | $3,266 |
| 2016 | $1,031 | $12,282 | $1,915 | $10,367 |
| 2015 | $1,106 | $12,282 | $1,915 | $10,367 |
| 2014 | $1,111 | $12,282 | $1,915 | $10,367 |
| 2013 | $1,352 | $15,355 | $2,394 | $12,961 |
Source: Public Records
Map
Nearby Homes
- 857 Steffen Ave
- 1076 Schumard Ave
- 1282 Steffen Ave
- 1401 Chamberlain Ave
- 1201 Dixie Ct
- 1118 Burns Ave
- 405 Home Ave
- 519 Westview Ave
- 15 Bonham Rd
- 1019 Crosley Ave
- 1704 Harmon Dr
- 1239 Springfield Pike
- 10152 Chester Rd
- 502 Marion Rd
- 29 Forest Ave
- 11 Rolling Hills Ct
- 1100 Timberland Dr
- 10167 Wayne Ave
- 0 E Leslie Ave
- 112 W Leslie Ave
- 777 Chamberlain Ave
- 789 Chamberlain Ave
- 788 Byrd Ave
- 793 Chamberlain Ave
- 752 Chamberlain Ave
- 754 Chamberlain Ave
- 756 Chamberlain Ave
- 801 Chamberlain Ave
- 800 Byrd Ave
- 639 N Wayne Ave
- 800 Chamberlain Ave
- 844 Byrd Ave
- 9784 Wayne Ave
- 833 Chamberlain Ave
- 739 Lindy Ave
- 822 Chamberlain Ave
- 832 Chamberlain Ave
- 9690 Wayne Ave
- 823 Lindy Ave
- 0 Chamberlain Ave Unit 1586138
Your Personal Tour Guide
Ask me questions while you tour the home.