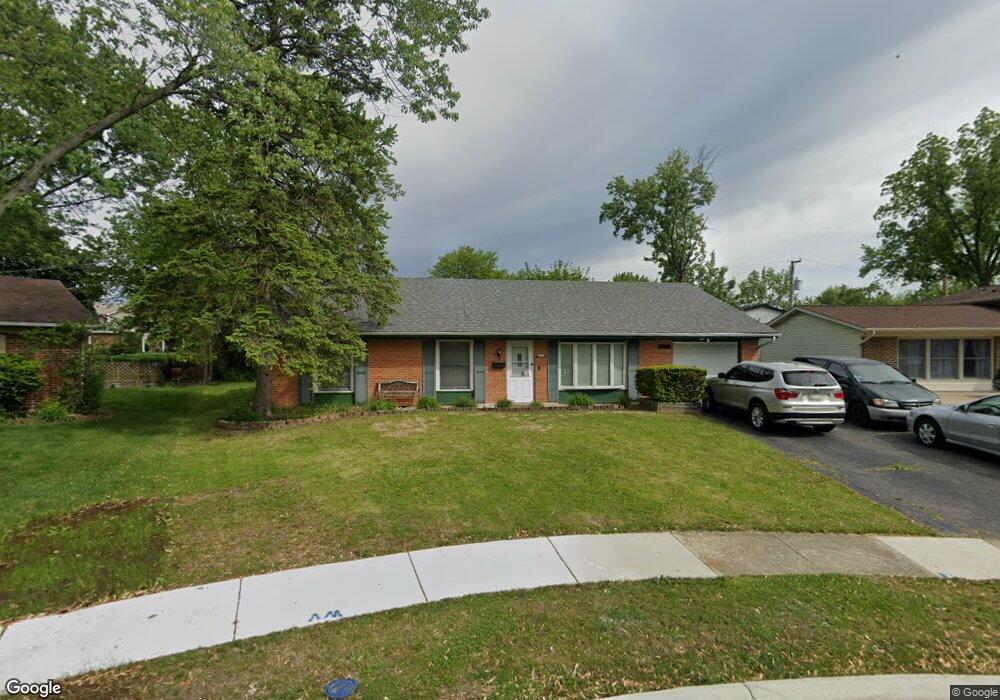
975 Glenside Ct Hanover Park, IL 60133
Estimated Value: $361,000 - $395,000
--
Bed
2
Baths
1,699
Sq Ft
$223/Sq Ft
Est. Value
About This Home
This home is located at 975 Glenside Ct, Hanover Park, IL 60133 and is currently estimated at $378,071, approximately $222 per square foot. 975 Glenside Ct is a home located in Cook County with nearby schools including Anne Fox Elementary School, Jane Addams Junior High School, and Hoffman Estates High School.
Ownership History
Date
Name
Owned For
Owner Type
Purchase Details
Closed on
Apr 13, 2022
Sold by
Kaleem Reshma T and Kaleem Y
Bought by
Kaleem Mohammed A and Kaleem Y
Current Estimated Value
Purchase Details
Closed on
Mar 15, 2022
Sold by
Kaleem Reshma T
Bought by
Kaleem Mohammed A
Purchase Details
Closed on
Jun 30, 1998
Sold by
Butcher Devry L
Bought by
Kaleem Mohammed A and Kaleem Reshma T
Home Financials for this Owner
Home Financials are based on the most recent Mortgage that was taken out on this home.
Original Mortgage
$124,200
Interest Rate
7.15%
Purchase Details
Closed on
Sep 30, 1996
Sold by
Quattrocchi Dominic and Quattrocchi Kristine Y
Bought by
Butcher Devry L
Home Financials for this Owner
Home Financials are based on the most recent Mortgage that was taken out on this home.
Original Mortgage
$124,233
Interest Rate
8.14%
Mortgage Type
FHA
Create a Home Valuation Report for This Property
The Home Valuation Report is an in-depth analysis detailing your home's value as well as a comparison with similar homes in the area
Home Values in the Area
Average Home Value in this Area
Purchase History
| Date | Buyer | Sale Price | Title Company |
|---|---|---|---|
| Kaleem Mohammed A | -- | -- | |
| Kaleem Mohammed A | -- | None Listed On Document | |
| Kaleem Mohammed A | -- | -- | |
| Kaleem Mohammed A | $138,000 | -- | |
| Butcher Devry L | $136,500 | -- |
Source: Public Records
Mortgage History
| Date | Status | Borrower | Loan Amount |
|---|---|---|---|
| Previous Owner | Kaleem Mohammed A | $124,200 | |
| Previous Owner | Butcher Devry L | $124,233 |
Source: Public Records
Tax History Compared to Growth
Tax History
| Year | Tax Paid | Tax Assessment Tax Assessment Total Assessment is a certain percentage of the fair market value that is determined by local assessors to be the total taxable value of land and additions on the property. | Land | Improvement |
|---|---|---|---|---|
| 2024 | $7,237 | $26,019 | $4,578 | $21,441 |
| 2023 | $6,987 | $26,019 | $4,578 | $21,441 |
| 2022 | $6,987 | $26,019 | $4,578 | $21,441 |
| 2021 | $6,081 | $20,430 | $2,993 | $17,437 |
| 2020 | $6,077 | $20,430 | $2,993 | $17,437 |
| 2019 | $6,163 | $22,955 | $2,993 | $19,962 |
| 2018 | $5,041 | $17,592 | $2,641 | $14,951 |
| 2017 | $5,427 | $18,865 | $2,641 | $16,224 |
| 2016 | $5,389 | $18,865 | $2,641 | $16,224 |
| 2015 | $5,173 | $17,129 | $2,288 | $14,841 |
| 2014 | $5,100 | $17,129 | $2,288 | $14,841 |
| 2013 | $4,926 | $17,129 | $2,288 | $14,841 |
Source: Public Records
Map
Nearby Homes
- 7843 Kensington Ln
- 7873 Asbury Cir S
- 630 S Walnut Ln
- 8181 Northway Dr
- 8138 N Carrolton Ct
- 7837 Huntington Cir S
- 802 Lexington Cir
- 8232 N Brockton Ct
- 1307 Kingsbury Dr Unit A
- 630 Clover Ln
- 7418 Nantucket Cove
- 224 Glenridge Ln
- 1316 Kingsbury Dr Unit 1
- 1933 Whittier Ln
- 1323 Kingsbury Dr Unit 2
- 1283 Bristol Ln
- 136 Caryville Ln
- 763 Verandah Dr
- 135 S Walnut Ln
- 7526 Bristol Ln Unit 502
- 977 Glenside Ct
- 953 Glenside Ct
- 968 Yorkshire Dr
- 952 Yorkshire Dr
- 974 Yorkshire Dr
- 981 Glenside Ct
- 946 Glenside Ct
- 946 Yorkshire Dr
- 986 Yorkshire Dr
- 934 Glenside Ct
- 930 Yorkshire Dr
- 922 Glenside Ct
- 910 Glenside Ct
- 999 Glenside Ct
- 7885 Carlisle Dr
- 7893 Carlisle Dr
- 7902 Northway Dr
- 7873 Carlisle Dr
- 924 Yorkshire Dr
- 7847 Carlisle Dr