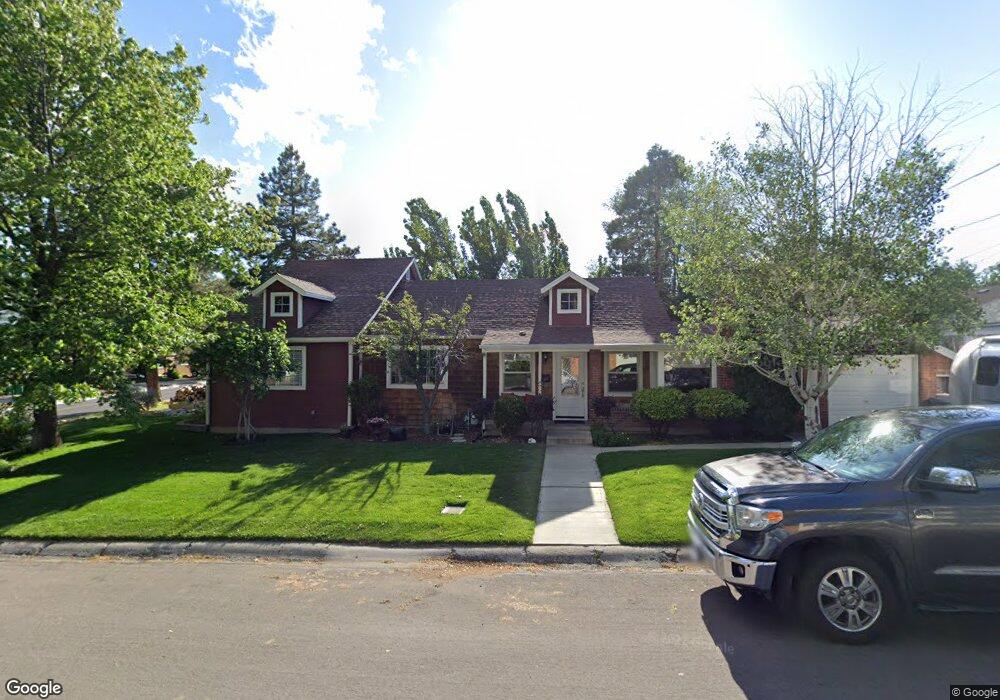
975 Vine St Reno, NV 89503
West University NeighborhoodEstimated Value: $557,910 - $629,000
3
Beds
2
Baths
1,962
Sq Ft
$306/Sq Ft
Est. Value
About This Home
This home is located at 975 Vine St, Reno, NV 89503 and is currently estimated at $599,728, approximately $305 per square foot. 975 Vine St is a home located in Washoe County with nearby schools including Peavine Elementary School, Archie Clayton Middle School, and Reno High School.
Ownership History
Date
Name
Owned For
Owner Type
Purchase Details
Closed on
Jun 28, 2002
Sold by
Neeser Brown Stephen C and Neeser Brown Shellie
Bought by
Keane Michael W and Keane Kristin
Current Estimated Value
Home Financials for this Owner
Home Financials are based on the most recent Mortgage that was taken out on this home.
Original Mortgage
$196,000
Outstanding Balance
$80,839
Interest Rate
6.6%
Estimated Equity
$518,889
Purchase Details
Closed on
Jul 7, 1999
Sold by
Neeser Shellie
Bought by
Brown Stephen C and Neeser Shellie J
Home Financials for this Owner
Home Financials are based on the most recent Mortgage that was taken out on this home.
Original Mortgage
$112,000
Interest Rate
7.24%
Purchase Details
Closed on
Oct 27, 1995
Sold by
Sprinkle Michael V and Neeser Sprinkle Shellie
Bought by
Sprinkle Michael V and Neeser Sprinkle Shellie
Home Financials for this Owner
Home Financials are based on the most recent Mortgage that was taken out on this home.
Original Mortgage
$96,800
Interest Rate
7.59%
Create a Home Valuation Report for This Property
The Home Valuation Report is an in-depth analysis detailing your home's value as well as a comparison with similar homes in the area
Home Values in the Area
Average Home Value in this Area
Purchase History
| Date | Buyer | Sale Price | Title Company |
|---|---|---|---|
| Keane Michael W | $245,000 | Stewart Title Northern Nevad | |
| Brown Stephen C | $56,000 | Western Title Company Inc | |
| Sprinkle Michael V | -- | First American Title Co |
Source: Public Records
Mortgage History
| Date | Status | Borrower | Loan Amount |
|---|---|---|---|
| Open | Keane Michael W | $196,000 | |
| Previous Owner | Brown Stephen C | $112,000 | |
| Previous Owner | Sprinkle Michael V | $96,800 | |
| Closed | Keane Michael W | $36,750 |
Source: Public Records
Tax History Compared to Growth
Tax History
| Year | Tax Paid | Tax Assessment Tax Assessment Total Assessment is a certain percentage of the fair market value that is determined by local assessors to be the total taxable value of land and additions on the property. | Land | Improvement |
|---|---|---|---|---|
| 2025 | $1,494 | $69,884 | $41,545 | $28,340 |
| 2024 | $1,451 | $69,071 | $41,195 | $27,876 |
| 2023 | $1,451 | $65,841 | $40,005 | $25,836 |
| 2022 | $1,409 | $52,565 | $31,500 | $21,065 |
| 2021 | $1,368 | $43,176 | $21,490 | $21,686 |
| 2020 | $1,326 | $43,417 | $21,000 | $22,417 |
| 2019 | $1,290 | $43,288 | $21,000 | $22,288 |
| 2018 | $1,252 | $37,085 | $14,875 | $22,210 |
| 2017 | $1,216 | $35,515 | $12,705 | $22,810 |
| 2016 | $1,188 | $36,491 | $12,600 | $23,891 |
| 2015 | $1,187 | $34,150 | $9,450 | $24,700 |
| 2014 | $1,152 | $32,212 | $7,980 | $24,232 |
| 2013 | -- | $30,210 | $5,880 | $24,330 |
Source: Public Records
Map
Nearby Homes
- 850 W 11th St
- 840 Brookfield Dr
- 1130 Bon Rea Way
- 960 Ralston St
- 1217 Keystone Ave
- 407 Imperial Blvd
- 1415 Kings Row
- 1480 Grandview Ave
- 1375 Wesley Dr
- 535 Citadel Rd
- 1035 N Sierra St
- 1510 Majestic Dr Unit one
- 250 College Dr
- 1455 Wesley Dr
- 1670 Majestic Dr
- 1449 Hillside Dr
- 1341 N Virginia St
- 820 Stoker Ave
- 1516 Coleman Dr
- 450 N Arlington Ave Unit 507