Estimated Value: $1,271,000 - $1,468,000
5
Beds
4
Baths
5,245
Sq Ft
$256/Sq Ft
Est. Value
About This Home
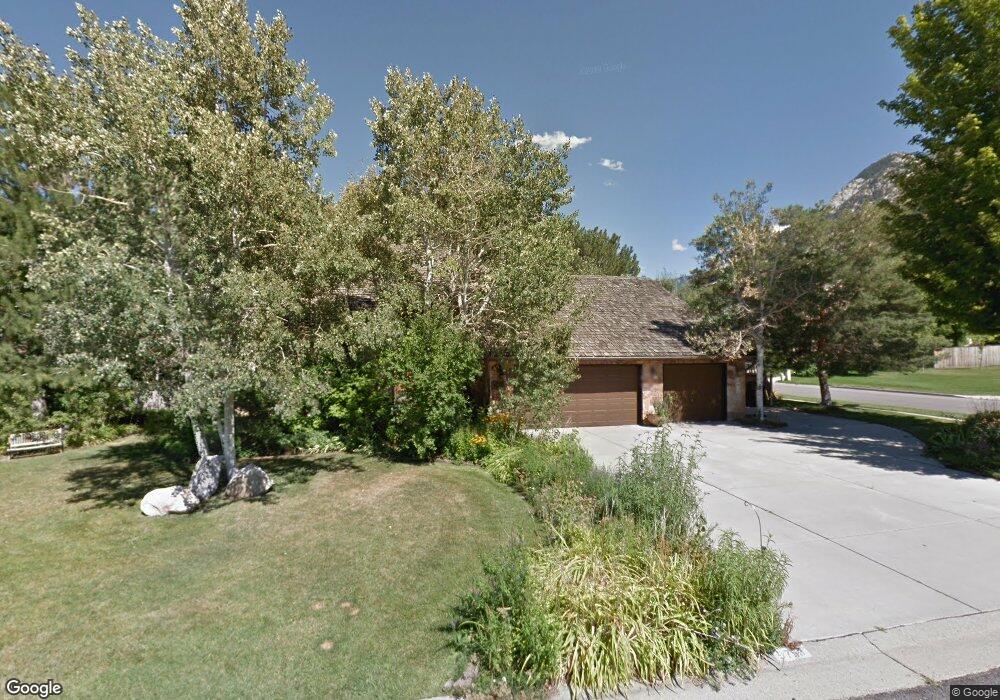
This home is located at 9753 Quail Ridge Rd, Sandy, UT 84092 and is currently estimated at $1,342,314, approximately $255 per square foot. 9753 Quail Ridge Rd is a home located in Salt Lake County with nearby schools including Granite Elementary School, Albion Middle School, and Brighton High School.
Ownership History
Date
Name
Owned For
Owner Type
Purchase Details
Closed on
Apr 15, 2003
Sold by
Harper Clark N and Nelson Vikki L
Bought by
Nelson Vikki L
Current Estimated Value
Home Financials for this Owner
Home Financials are based on the most recent Mortgage that was taken out on this home.
Original Mortgage
$210,000
Outstanding Balance
$88,822
Interest Rate
5.54%
Estimated Equity
$1,253,492
Purchase Details
Closed on
Nov 30, 1999
Sold by
Hartmann Daniel M
Bought by
Harper Clark N and Nelson Vikki L
Home Financials for this Owner
Home Financials are based on the most recent Mortgage that was taken out on this home.
Original Mortgage
$169,000
Interest Rate
7.95%
Purchase Details
Closed on
Nov 29, 1999
Sold by
Hartmann Brenda D
Bought by
Harper Clark N and Nelson Vikki L
Home Financials for this Owner
Home Financials are based on the most recent Mortgage that was taken out on this home.
Original Mortgage
$169,000
Interest Rate
7.95%
Create a Home Valuation Report for This Property
The Home Valuation Report is an in-depth analysis detailing your home's value as well as a comparison with similar homes in the area
Home Values in the Area
Average Home Value in this Area
Purchase History
| Date | Buyer | Sale Price | Title Company |
|---|---|---|---|
| Nelson Vikki L | -- | United Title Services | |
| Harper Clark N | -- | Backman Stewart Title Servic | |
| Harper Clark N | -- | Backman Stewart Title Servic |
Source: Public Records
Mortgage History
| Date | Status | Borrower | Loan Amount |
|---|---|---|---|
| Open | Nelson Vikki L | $210,000 | |
| Closed | Harper Clark N | $169,000 |
Source: Public Records
Tax History Compared to Growth
Tax History
| Year | Tax Paid | Tax Assessment Tax Assessment Total Assessment is a certain percentage of the fair market value that is determined by local assessors to be the total taxable value of land and additions on the property. | Land | Improvement |
|---|---|---|---|---|
| 2025 | $2,743 | $994,900 | $377,300 | $617,600 |
| 2024 | $2,743 | $951,300 | $359,200 | $592,100 |
| 2023 | $2,966 | $903,600 | $335,100 | $568,500 |
| 2022 | $2,327 | $889,600 | $328,500 | $561,100 |
| 2021 | $3,885 | $616,500 | $234,700 | $381,800 |
| 2020 | $3,803 | $570,000 | $198,200 | $371,800 |
| 2019 | $3,870 | $566,000 | $191,700 | $374,300 |
| 2018 | $3,624 | $555,000 | $191,700 | $363,300 |
| 2017 | $3,453 | $506,200 | $191,700 | $314,500 |
| 2016 | $3,199 | $467,400 | $186,200 | $281,200 |
| 2015 | $4,484 | $493,700 | $147,500 | $346,200 |
| 2014 | $4,391 | $470,700 | $144,500 | $326,200 |
Source: Public Records
Map
Nearby Homes
- 9512 S Granite Trail Ln E Unit 393
- 9472 S Granite Trail Ln E Unit 391
- 3357 Glacier Ln
- 3240 Granite Point Cir
- 3149 E 10000 S
- 10142 S Majestic Canyon Rd
- 10175 S Dimple Dell Rd
- 9623 Tannenbaum Cove
- 9577 S Hidden Pine Ln
- 10279 S Dimple Dell Rd E Unit 103
- 9673 Chylene Dr
- 10480 S Seven Springs Cir Unit 23
- 10471 S Wasatch Blvd
- 10471 S Wasatch Blvd Unit 27
- 10280 S Dimple Dell Rd
- 3409 Seven Springs Dr
- 10432 S Wasatch Blvd
- 8797 Hidden Oak Dr
- 8778 S Falcon Heights Ln
- 3316 E Lone Springs Cove
- 9753 S Quail Ridge Rd
- 9753 S Quailridge Rd
- 9733 S Quail Ridge Rd
- 9733 Quail Ridge Rd
- 3560 Little Cottonwood Ln
- 3568 E Little Cottonwood Ln
- 3568 Little Cottonwood Ln
- 9756 Quail Ridge Rd
- 3587 Little Cottonwood Ln
- 9744 Quail Ridge Rd
- 9715 Quail Ridge Rd
- 9715 S Quail Ridge Rd
- 3594 E Little Cottonwood Ln
- 3594 Little Cottonwood Ln
- 3608 Little Cottonwood Ln
- 3559 E Treseder View Ln
- 3573 E Treseder View Ln Unit 3
- 3547 E Treseder View Ln
- 9726 Quail Ridge Rd
- 3597 Little Cottonwood Ln