Estimated Value: $115,000 - $188,000
2
Beds
1
Bath
864
Sq Ft
$173/Sq Ft
Est. Value
About This Home
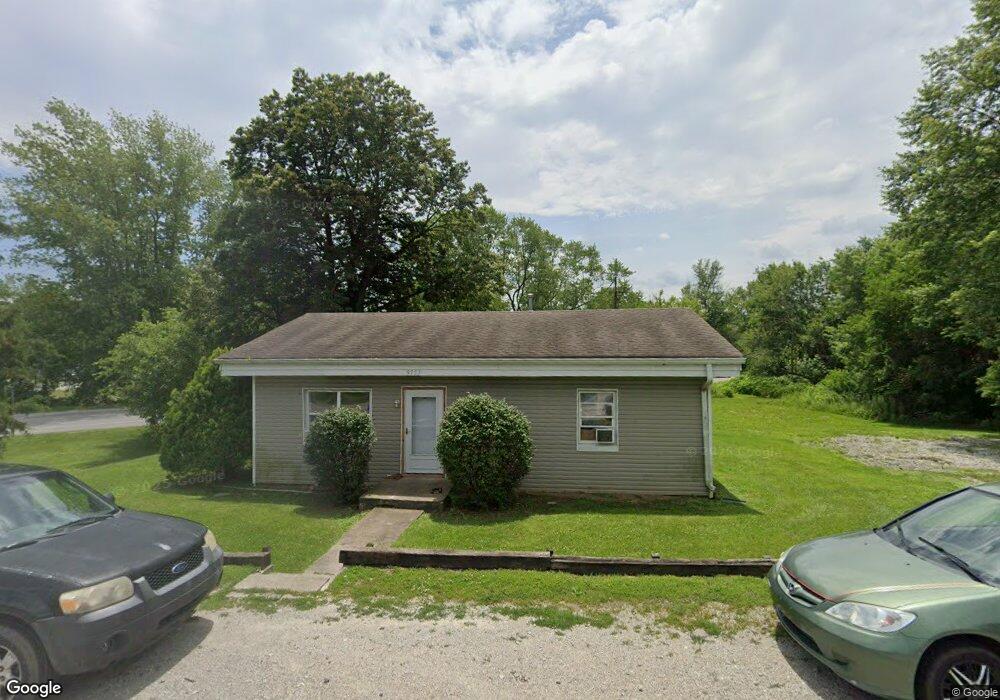
This home is located at 9757 W Main St, Lapel, IN 46051 and is currently estimated at $149,899, approximately $173 per square foot. 9757 W Main St is a home located in Madison County with nearby schools including Lapel Elementary School, Lapel Middle School, and Lapel Senior High School.
Ownership History
Date
Name
Owned For
Owner Type
Purchase Details
Closed on
May 15, 2014
Sold by
D & B Apartment Properties Llc
Bought by
Triple C Properties Llc
Current Estimated Value
Purchase Details
Closed on
Oct 19, 2011
Sold by
Frances Harry A
Bought by
D & B Apartment Properties Llc
Purchase Details
Closed on
Apr 29, 2011
Sold by
Community Bank
Bought by
France Harry A
Purchase Details
Closed on
Jan 20, 2011
Sold by
Davis Perry J and Davis Joe
Bought by
Community Bank
Purchase Details
Closed on
Dec 16, 2004
Sold by
Manufactureers & Traders Trust Co
Bought by
Davis Perry Joe
Purchase Details
Closed on
May 21, 2004
Sold by
Hughes Craig C and Hughes Jerri L
Bought by
Manufacturers & Traders Trust Co
Create a Home Valuation Report for This Property
The Home Valuation Report is an in-depth analysis detailing your home's value as well as a comparison with similar homes in the area
Home Values in the Area
Average Home Value in this Area
Purchase History
| Date | Buyer | Sale Price | Title Company |
|---|---|---|---|
| Triple C Properties Llc | -- | -- | |
| D & B Apartment Properties Llc | -- | None Available | |
| France Harry A | -- | -- | |
| Community Bank | $15,000 | None Available | |
| Davis Perry Joe | -- | -- | |
| Manufacturers & Traders Trust Co | $26,577 | -- |
Source: Public Records
Tax History Compared to Growth
Tax History
| Year | Tax Paid | Tax Assessment Tax Assessment Total Assessment is a certain percentage of the fair market value that is determined by local assessors to be the total taxable value of land and additions on the property. | Land | Improvement |
|---|---|---|---|---|
| 2025 | $1,264 | $63,200 | $14,600 | $48,600 |
| 2024 | $1,264 | $63,200 | $14,600 | $48,600 |
| 2023 | $1,162 | $58,100 | $13,900 | $44,200 |
| 2022 | $1,124 | $56,100 | $13,200 | $42,900 |
| 2021 | $1,054 | $52,600 | $13,200 | $39,400 |
| 2020 | $1,003 | $50,000 | $12,500 | $37,500 |
| 2019 | $1,990 | $49,000 | $12,500 | $36,500 |
| 2018 | $917 | $45,700 | $12,500 | $33,200 |
| 2017 | $910 | $45,400 | $12,500 | $32,900 |
| 2016 | $1,451 | $46,700 | $12,500 | $34,200 |
| 2014 | $684 | $33,900 | $12,500 | $21,400 |
| 2013 | $684 | $33,900 | $12,500 | $21,400 |
Source: Public Records
Map
Nearby Homes
- 223 W 11th St
- 223 W 9th St
- 16534 E 196th St
- 108 W 5th St
- 1019 N John St
- 614 S Woodward St
- 0 Vine St
- Pembrooke Plan at Montgomery Farms
- Addison Plan at Montgomery Farms
- Lafayette Plan at Montgomery Farms
- Manchester Plan at Montgomery Farms
- Hartford Plan at Montgomery Farms
- Concord Plan at Montgomery Farms
- Lancaster Plan at Montgomery Farms
- Kirkwood Plan at Montgomery Farms
- Waveland Plan at Montgomery Farms
- Sheffield Plan at Montgomery Farms
- 0 Cyntheanne Rd Unit MBR22071501
- 15123 E 196th St
- 15145 E 196th St
- 9769 W Main St
- 9735 W State Road 32
- 9787 W Main St
- 9756 W Main St
- 0 Indiana 13
- LOT 0 Indiana 13
- LOT 00 Indiana 13
- 000 Indiana 13
- 9900 Indiana 13
- 9768 W Main St
- 9768 W Main St
- 9796 W Water St
- 9798 W Main St
- 9749 W Walnut St
- 9767 W Walnut St
- 9698 W State Road 32
- 9698 Indiana 32
- 9787 W Walnut St
- 9822 W Main St
- 9797 W Walnut St