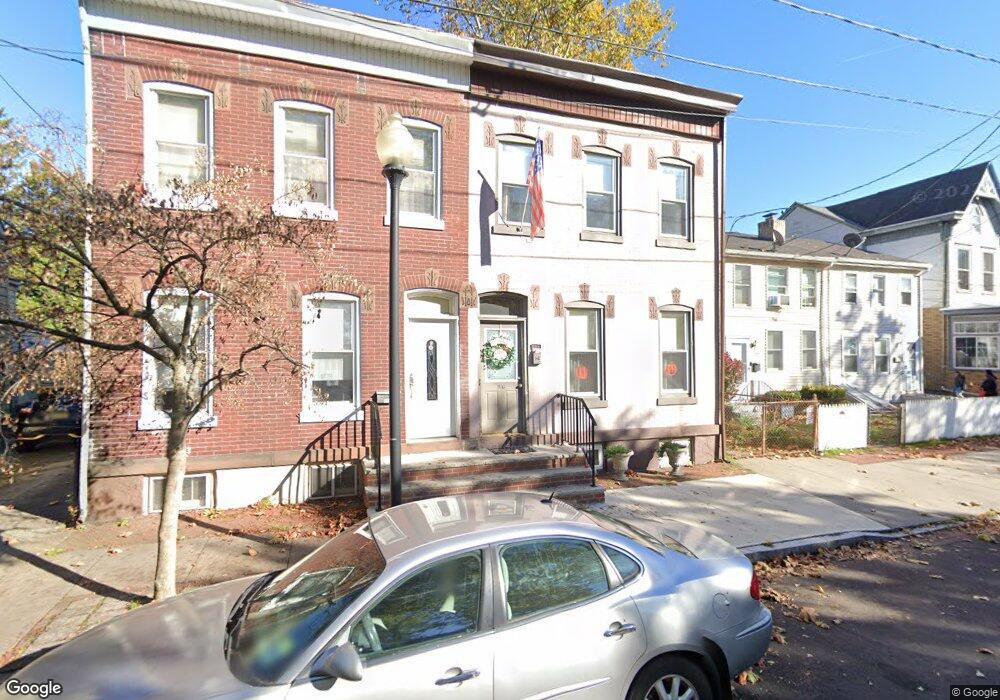
976 Lamberton St Trenton, NJ 08611
South Trenton NeighborhoodEstimated Value: $166,222 - $279,000
--
Bed
--
Bath
1,582
Sq Ft
$148/Sq Ft
Est. Value
About This Home
This home is located at 976 Lamberton St, Trenton, NJ 08611 and is currently estimated at $234,306, approximately $148 per square foot. 976 Lamberton St is a home located in Mercer County with nearby schools including Mott Elementary School, Parker Elementary School, and Grace A Dunn Middle School.
Ownership History
Date
Name
Owned For
Owner Type
Purchase Details
Closed on
Mar 2, 2016
Sold by
Beckman Joyce R and Beckman Thomas R
Bought by
Beckman Christian C and Beckman Thomas R
Current Estimated Value
Home Financials for this Owner
Home Financials are based on the most recent Mortgage that was taken out on this home.
Interest Rate
3.62%
Purchase Details
Closed on
Nov 14, 1985
Bought by
Beckman Joyce
Create a Home Valuation Report for This Property
The Home Valuation Report is an in-depth analysis detailing your home's value as well as a comparison with similar homes in the area
Home Values in the Area
Average Home Value in this Area
Purchase History
| Date | Buyer | Sale Price | Title Company |
|---|---|---|---|
| Beckman Christian C | $100 | -- | |
| Beckman Joyce | -- | -- |
Source: Public Records
Mortgage History
| Date | Status | Borrower | Loan Amount |
|---|---|---|---|
| Closed | Beckman Christian C | -- |
Source: Public Records
Tax History Compared to Growth
Tax History
| Year | Tax Paid | Tax Assessment Tax Assessment Total Assessment is a certain percentage of the fair market value that is determined by local assessors to be the total taxable value of land and additions on the property. | Land | Improvement |
|---|---|---|---|---|
| 2025 | $3,550 | $61,200 | $6,900 | $54,300 |
| 2024 | $3,407 | $61,200 | $6,900 | $54,300 |
| 2023 | $3,407 | $61,200 | $6,900 | $54,300 |
| 2022 | $3,340 | $61,200 | $6,900 | $54,300 |
| 2021 | $3,398 | $61,200 | $6,900 | $54,300 |
| 2020 | $3,387 | $61,200 | $6,900 | $54,300 |
| 2019 | $3,333 | $61,200 | $6,900 | $54,300 |
| 2018 | $3,190 | $61,200 | $6,900 | $54,300 |
| 2017 | $3,032 | $61,200 | $6,900 | $54,300 |
| 2016 | $4,643 | $80,700 | $14,100 | $66,600 |
| 2015 | $4,627 | $80,700 | $14,100 | $66,600 |
| 2014 | $4,605 | $80,700 | $14,100 | $66,600 |
Source: Public Records
Map
Nearby Homes